empty
27.05.2023 08:46 PM
Weekly review of EUR/USD for May 22-27, 2023

This image is no longer relevant

Overview :

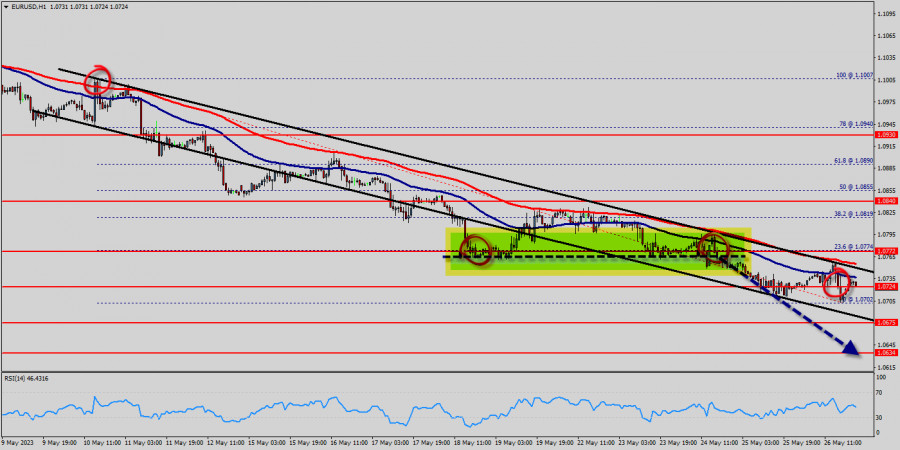
The EUR/USD pair fell from the level of 1.0830 to bottom at 1.0761 this week. Today, the EUR/USD pair has faced strong support at the level of 1.0761. But, the strong support has already faced at the level of 1.0700 and the pair is likely to try to approach it in order to test it again and form a double bottom. Hence, the EUR/USD pair is continuing to trade in a bearish trend from the new support level of 1.0761; to form a bullish channel. According to the previous events, we expect the pair to move between 1.0830 and 1.0700.

Also, it should be noted major resistance is seen at 1.0873, while immediate resistance is found at 1.0830. Then, we may anticipate potential testing of 1.0761 to take place soon. Moreover, if the pair succeeds in passing through the level of 1.0761, the market will indicate a bearish opportunity below the level of 1.0761.

A breakout of that target will move the pair further downwards to 1.0700. Sell orders are recommended above the area of 1.0761 with the first target at the level of 1.0700; and continue towards 1.0650.

On the other hand, if the EUR/USD pair fails to break out through the support level of 1.0761; the market will rise further to the level of 1.0873 (daily resistance 2). The EUR/USD pair faced strong resistances at the level of 1.0930 because this price coincided with the double top on the hourly chart since two weeks. So, the strong resistance has been already formed at the level of 1.0930 and the pair is likely to try to approach it in order to test it again, but the trend failed thrice. Briefly, last week the EUR/USD pair traded higher and closed the day in the positive territory around 1.0930. It has also risen a little, having risen to the level of 1.0930.

On the hourly chart, the GBP/USD pair is still trading above the MA (100) H1 moving average line (1.0840). The situation is similar on the one-hour of 4H chart. Based on the foregoing, it is probably worth sticking to the south direction in trading, and as long as the GBP/USD pair remains below MA 100 H1, it may be necessary to look for entry points to buy for the formation of a correction.

However, if the pair fails to pass through the level of 1.0930 in coming two days, the market will indicate a bearish opportunity below the new strong resistance level of 1.0930 (the level of 1.0930 coincides with a ratio of 100% Fibonacci - last bullish wave - double top).

Moreover, the RSI starts signaling a downward trend, as the trend is still showing strength above the moving average (100) and (50).

Thus, the market is indicating a bearish opportunity below 1.0930 so it will be good to sell at 1.0930 with the first target of 1.0772. It will also call for a downtrend in order to continue towards 1.0724. The daily strong support is seen at 1.0675.

The stop loss should always be taken into account, for that it will be reasonable to set your stop loss at the level of 1.0930. It should be noticed, the EUR/USD pair is the forex ticker that shows the value of the Euro against the US Dollar. It tells traders how many US Dollars are needed to buy a Euro.

The Euro is one of the oldest and most widely traded currency pairs in the world. Follow the live EUR/USD rate with the chart and keep up to date with Euro news and analysis. Plan your trades with the EUR/USD forecast. Probably, the main scenario is continued decrease to 1.0724 (session low). The alternative scenario is consolidation above the MA 100 H1 level (1.0675), followed by a climp to 1.0930

Select timeframe
5
min
15
min
30
min
1
hour
4
hours
1
day
1
week
Earn on cryptocurrency rate changes with InstaForex
Download MetaTrader 4 and open your first trade
  • Grand Choice
    Contest by
    InstaForex
    InstaForex always strives to help you
    fulfill your biggest dreams.
    JOIN CONTEST

Recommended Stories

Technical Analysis of Intraday Price Movement of AUD/JPY Cross Currency Pairs, Wednesday, April 23, 2025.

With the appearance of Divergence between the price movement of the AUD/JPY cross currency pair with the Stochastic Oscillator indicator and the price movement of AUD/JPY which is above

Arief Makmur 06:37 2025-04-23 UTC+2

Technical Analysis of Intraday Price Movement of Gold Commodity Instrument, Wednesday, April 23, 2025.

If we look at the 4-hour chart, the Gold commodity instrument appears to still be moving in a Bullish bias, but with the appearance of Divergence between the Gold price

Arief Makmur 06:37 2025-04-23 UTC+2

Forex forecast 22/04/2025: EUR/USD, GBP/USD, USD/JPY and Bitcoin

Useful links: My other articles are available in this section InstaForex course for beginners Popular Analytics Open trading account Important: The begginers in forex trading need to be very careful

Sebastian Seliga 10:08 2025-04-22 UTC+2

Technical Analysis of Intraday Price Movement of GBP/CHF Cross Currency Pairs, Tuesday April 22, 2025.

If we look at the 4-hour chart of the GBP/CHF cross currency pair, there are several interesting facts. First, the appearance of a Triangle pattern followed by the movement

Arief Makmur 06:58 2025-04-22 UTC+2

Technical Analysis of Intraday Price Movement of AUD/CAD Cross Currency Pairs, Tuesday April 22, 2025.

With the price movement of the AUD/CAD cross currency pair moving above the WMA (21) which has an upward slopes and the appearance of Convergence between the price movement

Arief Makmur 06:58 2025-04-22 UTC+2

Trading Signals for GOLD (XAU/USD) for April 21-25, 2025: sell below $3,422 (overbought - 8/8 Murray)

The eagle indicator has reached overbought levels. However, the metal could still reach the high around 8/8 Murray, which represents a strong barrier for gold. Below this area, we could

Dimitrios Zappas 17:23 2025-04-21 UTC+2

Technical Analysis of Intraday Price Movement EUR/GBP Cross Currency Pairs, Monday April 21, 2025

From what is seen on the 4-hour chart, the EUR/GBP cross currency pair appears to be moving above the EMA (100), which indicates that Buyers dominate the currency pair

Arief Makmur 04:19 2025-04-21 UTC+2

Technical Analysis of Intraday Price Movement USD/JPY Main Currency Pairs, Monday April 21, 2025.

With the appearance of Convergence between the price movement of the main currency pair USD/JPY with the Stochastic Oscillator indicator and the position of the EMA (100) which is above

Arief Makmur 04:19 2025-04-21 UTC+2

Forex forecast 18/04/2025: EUR/USD, GBP/USD, Gold and Bitcoin

Useful links: My other articles are available in this section InstaForex course for beginners Popular Analytics Open trading account Important: The begginers in forex trading need to be very careful

Sebastian Seliga 10:18 2025-04-18 UTC+2

Gold: Ongoing Uncertainty Continues to Support Gold Prices

Gold prices continue to receive support amid the fog of uncertainty surrounding the future course of the tariff wars initiated by Donald Trump. The price of gold has been climbing

Pati Gani 11:49 2025-04-17 UTC+2
Can't speak right now?
Ask your question in the chat.
Widget callback
 

Dear visitor,

Your IP address shows that you are currently located in the USA. If you are a resident of the United States, you are prohibited from using the services of InstaFintech Group including online trading, online transfers, deposit/withdrawal of funds, etc.

If you think you are seeing this message by mistake and your location is not the US, kindly proceed to the website. Otherwise, you must leave the website in order to comply with government restrictions.

Why does your IP address show your location as the USA?

  • - you are using a VPN provided by a hosting company based in the United States;
  • - your IP does not have proper WHOIS records;
  • - an error occurred in the WHOIS geolocation database.

Please confirm whether you are a US resident or not by clicking the relevant button below. If you choose the wrong option, being a US resident, you will not be able to open an account with InstaForex anyway.

We are sorry for any inconvenience caused by this message.