Analysis of GBP/USD on the 5-minute chart
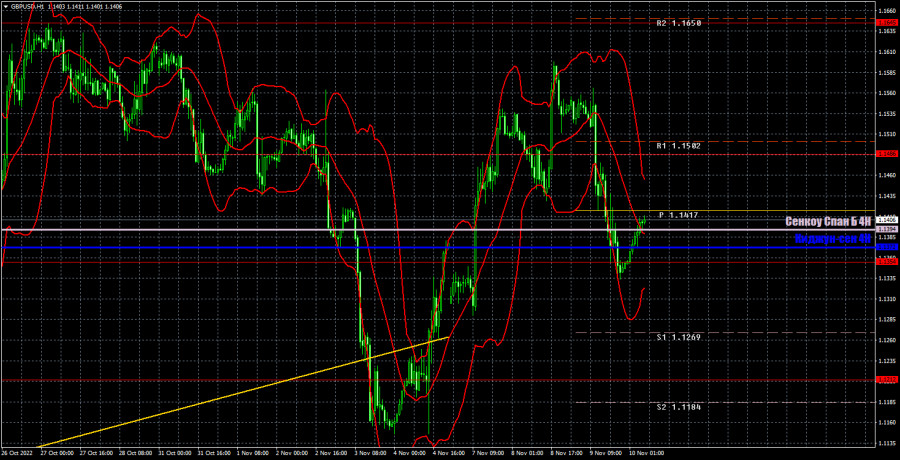
On Wednesday, the pound/dollar pair unexpectedly dropped without any reason. Yesterday, neither the UK nor the US published important reports. Nevertheless, in the last 4-5 days, the pair has been trading according to its own rules. Thus, there is no use to search for a logical explanation of the situation. We can only rely on levels and lines. Now, it is even difficult to determine the main tendency since there is neither a trend line nor a channel. A technical picture is unclear. The British pound dropped to the Senkou Span B and Kijun-sen lines. However, it failed to break them or bounce off them. Today, the US is going to disclose its inflation report, which will slightly boost market volatility. In this case, we will see some logical movements.
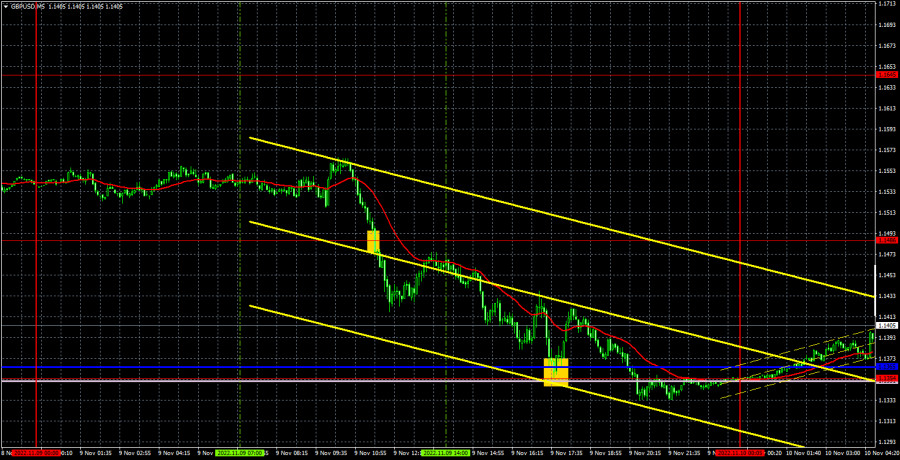
Although there were a few trading signals on the pound/dollar pair, they all were strong. The first signal was formed after the price broke 1.1486. Traders went short, pushing the price to 1.1351-1.1365. As a result, the profit totaled about 100 pips. The pair bounced off the mentioned area but failed to hit the target level. Traders opened a position and had to close it manually in about two hours. This trade also brought a profit of 20 pips. As a result, the income from the pound/dollar pair exceeded losses from the euro/dollar pair.
COT report
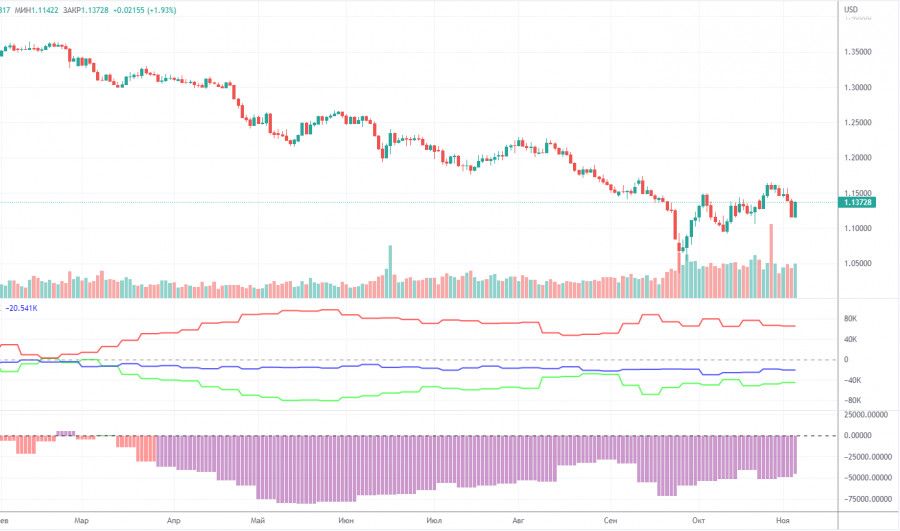
The recent COT report on the British pound unveiled the weakening of the bearish sentiment. During the given period, non-commercial traders closed 8.5K buy orders and 11.5K sell orders. Thus, the net position of non-commercial traders increased by 3 thousand, which is insignificant for the pound sterling. The net position indicator has been gradually growing in recent weeks. However, it is not the first time that it is growing, whereas the sentiment of major players remains absolutely bearish. As a result, the pound sterling is likely to maintain a downward trend in the medium term. Judging by the situation with the euro, the pound/dollar pair will hardly gain in value. The fact is that traders still prefer the US dollar to the pound sterling. At the moment, non-commercial traders are holding about 79K sell orders and 34K buy orders. The difference is quite noticeable. The pound sterling is unlikely to rise amid bearish sentiment. The number of opened buy orders exceeds the number of opened sell orders by 21 thousand. However, this indicator neither supports the pound sterling. We are still skeptical about the pound's long-term increase, but there are some technical reasons for this.
Analysis of GBP/USD on the one-hour chart

On the one-hour chart, the pound/dollar pair is showing movements that could hardly be determined as any trend. At first, the pair tumbled and fixed below the key line of the Ichimoku indicator as well as the trend line. Then, the pair consolidated above the Kijun-sen and Senkou Span B lines. Now, it is trading near these lines. On bigger time frames, there are some prerequisites for a longer rise. However, the situation may alter at any moment. At the moment, the pound's movement is illogical. On November 10, there are the following important levels: 1.1060, 1.1212, 1.1354, 1.1486, 1.1645, 1.1760. The Kijun-sen and Senkou Span B lines may also act as a source of signals. Breakouts and rebounds from these levels could be used as signals. Lines of the Ichimoku indicator may move during the day, which should be taken into account when determining trading signals. Apart from that, there are also support and resistance levels, which could be used to lock in profits. On Thursday, the UK is not going to disclose any important report. However, the market is likely to remain volatile, which is good for traders. In the second part of the day, all eyes will be turned to the US inflation report.
What we see on the trading charts:
Price levels of support and resistance are thick red lines, near which the movement may end. They do not provide trading signals.
The Kijun-sen and Senkou Span B lines are the lines of the Ichimoku indicator, moved to the one-hour chart from the 4-hour one. They are strong lines.
Extreme levels are thin red lines from which the price bounced earlier. They provide trading signals.
Yellow lines are trend lines, trend channels, and any other technical patterns.
Indicator 1 on the COT charts reflects the net position size of each category of traders.
Indicator 2 on the COT charts reflects the net position size for the non-commercial group.


