empty
08.02.2023 04:44 PM
S&P 500 outlook for February 8, 2023

This image is no longer relevant

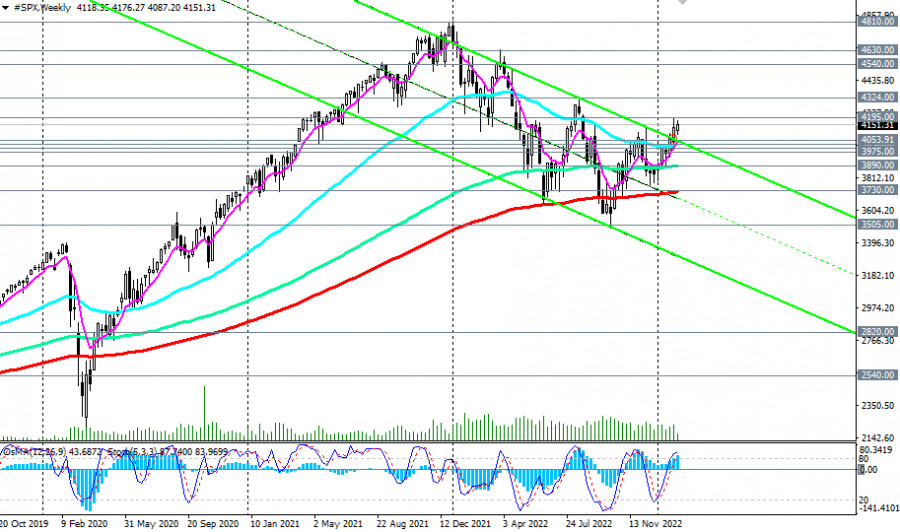
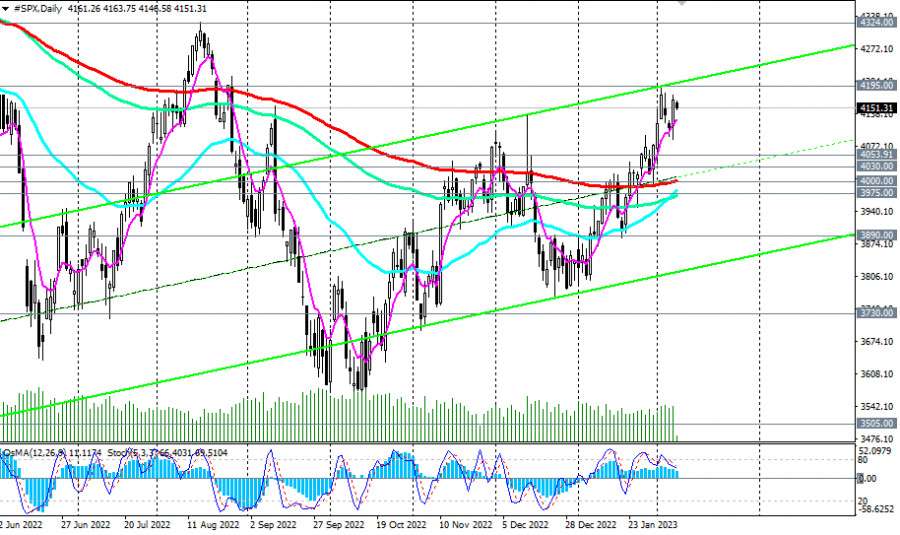
Futures on S&P 500 broad market index (reflected as CFD #SPX in the trading terminal) remain positive, trading in a bull market zone, above key support levels 4030.00 (50 EMA on the weekly chart), 4000.00 (200 EMA on the daily chart).

Despite the Fed's hawkish statements about the prospects for monetary policy, economists believe that it remains soft, given high inflation and a strong labor market. At the same time, high inflation contributes to the further depreciation of the dollar. In addition, the U.S. stock market seems to have turned upward again after the December Fed meeting, at which the rate was raised by 0.50% (and not by 0.75%, as it was in June, July, September, November) and Fed Chairman Jerome Powell noted that "the received data on inflation for October and November do indicate a long-awaited reduction in price pressure" although, in his opinion, "much more evidence is needed to be sure of a decrease in inflation."

After the December meeting, market participants began to bet on a further slowdown in the pace of the Fed's interest rate hike, and then on a pause and, possibly, the reverse process in the near future.

This image is no longer relevant

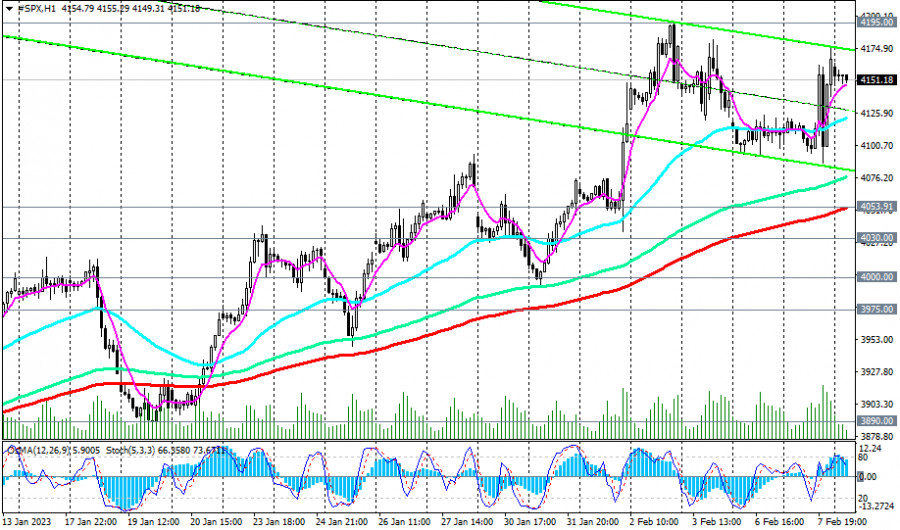
One way or another, the S&P500 futures are currently trading near 4150.00, in the zone of 6-month highs reached on February 2 near 4195.00. The breakout of this local resistance level will be additional evidence in favor of the revival of the global bullish trend of the S&P 500 and, perhaps, of the entire U.S. stock market.

Above the important short-term support at 4054.00 (200 EMA on the 1-hour chart), nothing threatens long positions.

This image is no longer relevant

But its breakdown will be the first signal for shorts trading on the S&P 500. The breakdown of the key support level 4000.00 (200 EMA on the daily chart), 3975.00 (144 EMA on the daily chart) will return the S&P 500 inside the downward channel on the weekly chart, sending the index to the key support level 3730.00 (200 EMA on the weekly chart).

However, only a breakdown of the strategic support levels 2820.00 (144 EMA on the monthly chart), 2540.00 (200 EMA on the monthly chart) will indicate the breaking of the long-term bullish trend of the S&P 500.

In general, the buy-and-hold strategy is still relevant for the U.S. stock market and its S&P 500 index.

Support levels: 4122.00 4085.00 4054.00 4030.00 4000.00 3975.00 3890.00 3800.00 3730.00 3700.00 3600.00 3500.00 2820.00 0.040

Resistance levels: 4195.00, 4324.00, 4540.00, 4630.00, 4810.00

Trading recommendations

Sell Stop 4085.00. Stop-Loss 4205.00. Whole 4054.00, 4030.00, 4000.00, 3975.00, 3890.00, 3800.00, 3730.00

Buy Stop 4205.00. Stop-Loss 4085.00. Whole 4300.00, 4320.00, 4400.00, 4500.00, 4600.00, 4700.0, 4800.00, 4900.00

Jurij Tolin,
Analytical expert of InstaForex
© 2007-2025
Select timeframe
5
min
15
min
30
min
1
hour
4
hours
1
day
1
week
Earn on cryptocurrency rate changes with InstaForex
Download MetaTrader 4 and open your first trade
  • Grand Choice
    Contest by
    InstaForex
    InstaForex always strives to help you
    fulfill your biggest dreams.
    JOIN CONTEST

Recommended Stories

GBP/USD: Trading Plan for the U.S. Session on May 8th (Review of Morning Trades)

In my morning forecast, I focused on the 1.3286 level and planned to base market entries from it. Let's look at the 5-minute chart and analyze what happened. A breakout

Miroslaw Bawulski 19:22 2025-05-08 UTC+2

EUR/USD: Trading Plan for the U.S. Session on May 8th (Review of Morning Trades)

In my morning forecast, I focused on the 1.1269 level and planned to make market entry decisions from it. Let's take a look at the 5-minute chart and analyze what

Miroslaw Bawulski 19:19 2025-05-08 UTC+2

How to Trade the GBP/USD Pair on May 8? Simple Tips and Trade Analysis for Beginners

Analysis of Wednesday's Trades 1H Chart of GBP/USD The GBP/USD pair showed no notable movements on Wednesday. After Jerome Powell stated the need for more time to assess the full

Paolo Greco 06:05 2025-05-08 UTC+2

How to Trade the EUR/USD Pair on May 8? Simple Tips and Trade Analysis for Beginners

Analysis of Wednesday's Trades 1H Chart of EUR/USD The EUR/USD currency pair continued to trade within the sideways channel on Wednesday, which is visible on the hourly timeframe

Paolo Greco 06:05 2025-05-08 UTC+2

Trading Recommendations and Analysis for GBP/USD on May 8: The Pound Sees No Reason to Panic

On Wednesday, the GBP/USD currency pair continued trading within a sideways channel, clearly visible on the hourly timeframe. There was virtually no movement throughout the day, and no fundamental

Paolo Greco 04:19 2025-05-08 UTC+2

Trading Recommendations and Analysis for EUR/USD on May 8: All the Excitement Is Behind Us

On Wednesday, the EUR/USD currency pair continued to trade in the same flat range. The 1.1274 and 1.1426 levels bound the broader sideways channel, while the narrower channel ranges between

Paolo Greco 04:18 2025-05-08 UTC+2

GBP/USD: Trading Plan for the U.S. Session on May 7th (Review of Morning Trades)

In my morning forecast, I focused on the 1.3335 level and planned to base entry decisions around it. Let's look at the 5-minute chart and see what happened. A breakout

Miroslaw Bawulski 19:39 2025-05-07 UTC+2

EUR/USD: Trading Plan for the U.S. Session on May 7th (Review of Morning Trades)

In my morning forecast, I highlighted the 1.1379 level and planned to base market entry decisions around it. Let's look at the 5-minute chart to understand what happened. A rise

Miroslaw Bawulski 19:36 2025-05-07 UTC+2

How to Trade the GBP/USD Pair on May 7? Simple Tips and Trade Analysis for Beginners

Analysis of Tuesday's Trades 1H Chart of GBP/USD The GBP/USD pair exhibited a notable upward movement on Tuesday, although it remains within a sideways channel that may not be immediately

Paolo Greco 06:55 2025-05-07 UTC+2

How to Trade the EUR/USD Pair on May 7? Simple Tips and Trade Analysis for Beginners

Analysis of Tuesday's Trades 1H Chart of EUR/USD On Tuesday, the EUR/USD currency pair traded completely flat. Throughout the day, there were no significant reports or events either

Paolo Greco 06:55 2025-05-07 UTC+2
Can't speak right now?
Ask your question in the chat.
Widget callback
 

Dear visitor,

Your IP address shows that you are currently located in the USA. If you are a resident of the United States, you are prohibited from using the services of InstaFintech Group including online trading, online transfers, deposit/withdrawal of funds, etc.

If you think you are seeing this message by mistake and your location is not the US, kindly proceed to the website. Otherwise, you must leave the website in order to comply with government restrictions.

Why does your IP address show your location as the USA?

  • - you are using a VPN provided by a hosting company based in the United States;
  • - your IP does not have proper WHOIS records;
  • - an error occurred in the WHOIS geolocation database.

Please confirm whether you are a US resident or not by clicking the relevant button below. If you choose the wrong option, being a US resident, you will not be able to open an account with InstaForex anyway.

We are sorry for any inconvenience caused by this message.