Analysis of the 5-minute chart for the GBP/USD.
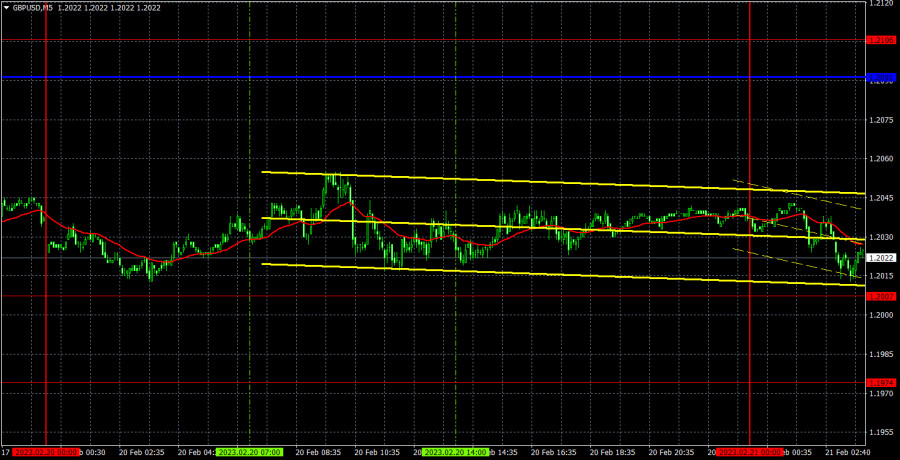
On Monday, the GBP/USD currency pair was almost completely inactive. Monday was completely boring, with nothing worth analyzing or even highlighting. There were no noteworthy or exciting happenings, or at least none that could have awakened the market. Consequently, given the current situation, all we can do is observe that the downward trend is still in place and that it is just as sluggish as the euro, while also hoping that today's volatility will be higher.
On Monday, no trading signals developed at all, just like with the euro. And if the daily volatility was 42 points, what might be predicted? The only time the pair came close to reaching the 1.2007 level was during the Asian trading session. As a result, despite our advice, opening deals yesterday was not necessary. All that is left to do is wait for the market to open. The pound will probably keep going down steadily.
COT Report

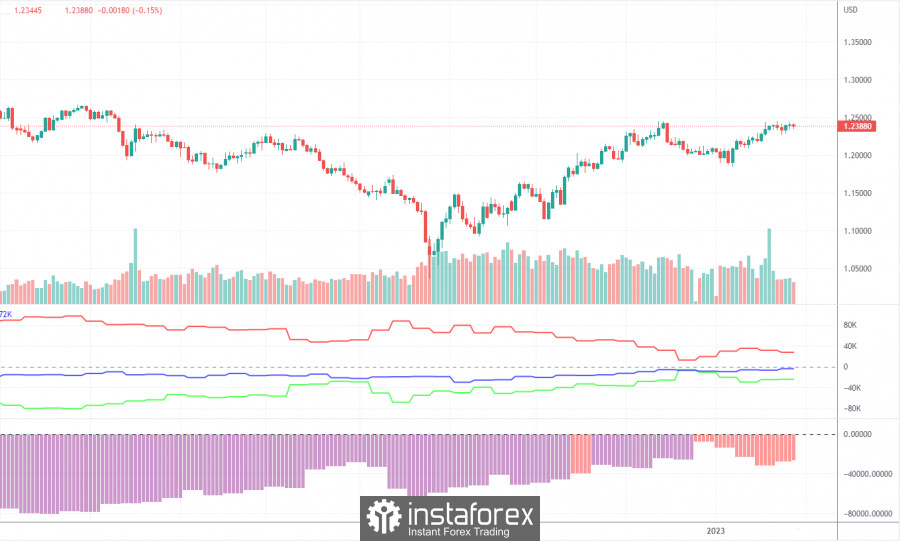
The "bearish" sentiment appeared to be weakening in the most recent COT report on the British pound. The non-commercial group concluded 6,700 buy contracts and 7.5 thousand sell contracts throughout the week. As a result, non-commercial traders' net position increased by 0.8 thousand. The net position indicator has been slowly rising over the past few months, and although it hasn't yet, it suggests that significant players' attitudes may soon turn "bullish." Although the value of the pound against the dollar has increased recently, it is quite challenging to identify the basic reasons behind this growth. While there is still a need for adjustment, we cannot rule out the possibility that the pound may continue to decline in the near (or medium) term. There are no questions because COT reports have generally matched the trend of the pound in recent months. Purchases may continue in the future for a few months, but they must have the right "foundation" underneath them, which they do not now have because the net position is not even "bullish" yet. A total of 35,000 contracts for purchases and 59,000 contracts for sales have now been opened by the non-commercial group. Although there are some reasons to believe that the British currency would increase over the long run, geopolitics does not support such a significant and rapid pound sterling strengthening.
GBP/USD 1H analysis

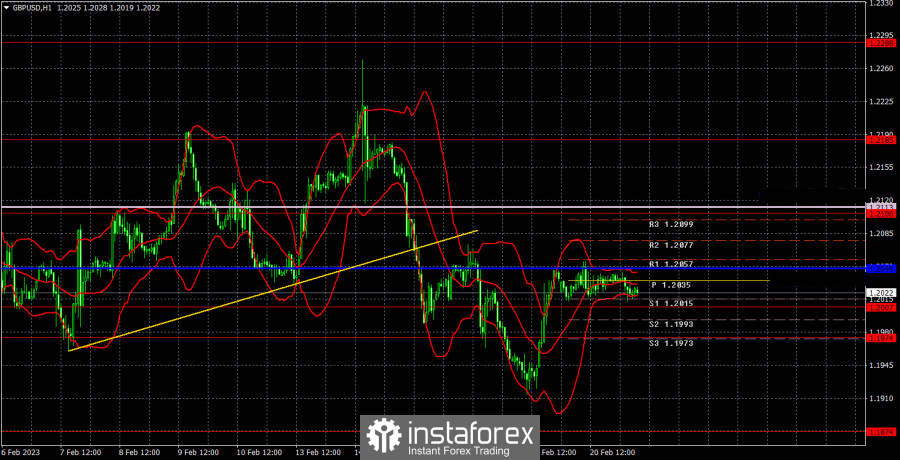
The pound/dollar pair showed a new wave of upward movement on the hourly timeframe on Friday and concluded it relatively quickly, as seen by not crossing the crucial Kijun-sen line. As a result, even though the downward trend is weak, it still exists because the pair is below both Ichimoku indicator lines. We highlight the following crucial levels on February 21: 1.1760, 1.1874, 1.1974-1.2007, 1.2106, 1.2185, 1.2288, 1.2342, 1.2429. There are more signal sources, including the Senkou Span B (1.2113) and Kijun-sen (1.2048) lines. These levels and lines can be "bounced" and "surmounted" by signals. It is advised to set the stop-loss level to breakeven when the price has moved 20 points in the desired direction. The Ichimoku indicator's lines might move during the day; therefore, this should be considered when choosing trade signals. Support and resistance levels that can be used to determine transaction profit margins are also shown in the graphic. On Tuesday, statistics on business activity will be released in the US and the UK. We do not anticipate a strong response to these publications since they are only marginally significant. These articles, however, can at least motivate the pair to move on from their fixed position.
Explanations for the illustrations
Thick red lines represent price levels of support and resistance (resistance/support), where the movement may come to an end. They don't provide trading signals, though.
The Ichimoku indicator's Kijun-sen and Senkou Span B lines have been moved from the 4-hour timeframe to the hourly one.
The price previously bounced off of the tiny red lines that represent extreme levels. They provide signals for trading.
Trend lines, trend channels, and other technical patterns are represented by yellow lines.
The net position size of each trading category is represented by indicator 1 on the COT charts.
The net position size for the "Non-commercial" category is shown by indicator 2 on the COT charts.


