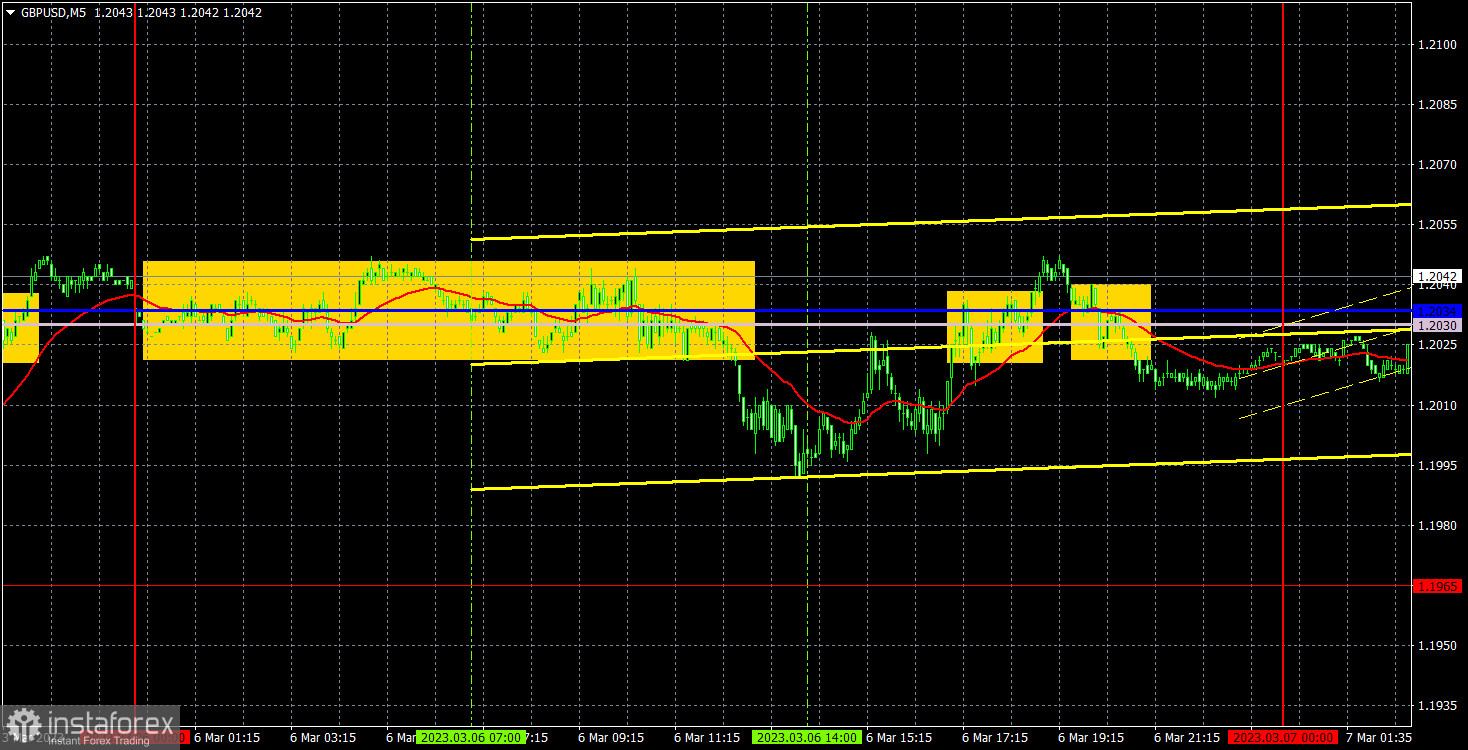
M5 chart of GBP/USD
On Monday, GBP/USD was generally flat. The pair moved exactly along the lines of the Ichimoku indicator for half a day. The lines practically merged into one, which indicates a flat trend in the M5 and H1 time frames. Naturally, trading is uncomfortable during a flat trend on the market. In fact, the trend has been observed in the H1 time frame for several weeks now. We have repeatedly mentioned that fact. The last signal came after bouncing off the lower limit of the channel at 1.1927. Therefore, regardless of fundamental factors, the pair is likely to move toward the upper limit of the channel at 1.2143 in the near term. This week, all eyes will be on Fed Chair Powell's testimony and US macro statistics on Friday. It remains to be seen whether Powell says something new. Anyway, we expect a bear trend on GBP/USD once the flat trend is over.
Analyzing trading signals in the M5 time frame was pointless. It became clear that the pair would move sideways already in the European session. When the price moved away from the Kijun-sen and Senkou Span B, selling could have been considered. The price fell by about 20 pips, which was enough to set a Stop Loss at the breakeven point. In fact, no trading signal was made. When it came to the signals in the American trading session, there was no point in pricing them because it had already become obvious how the pair would be traded by that time.
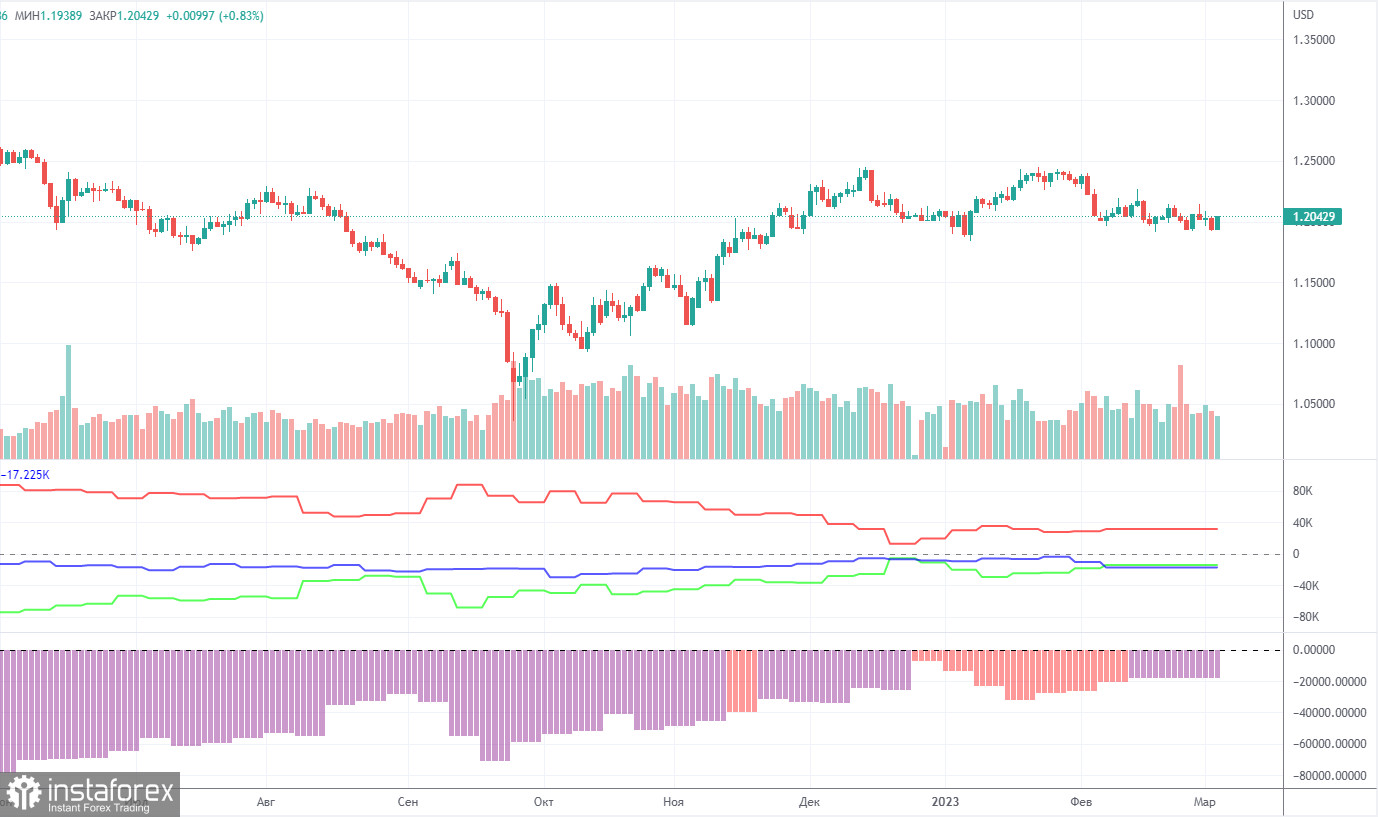
COT report:
The latest COT report on GBP/USD dates back to February 7. Due to a technical glitch, there have been no fresh reports for about a month. Naturally, analyzing outdated reports is of no use. Anyway, that is better than nothing at all. According to the latest data, non-commercial traders opened 10,900 long positions and 6,700 short ones. The net position grew by 4,200. The net non-commercial position has been bullish in recent months although sentiment remains bearish. The pound has been on the rise against the greenback for some unknown reason. We should not rule out the possibility of a strong decline in price in the near term. Technically, it has already started to decline although it seems to be a flat trend. In fact, the movement of GBP/USD is now akin to that of EUR/USD. At the same time, the net position on EUR/USD is positive, signaling the upcoming end of the bullish impulse. Meanwhile, the net position on GBP/USD is negative. Non-commercial traders now hold 61,000 sell positions and 47,000 long positions. There is still a gap. We are still skeptical that the pair will be bullish in the long term and expect a steep drop.
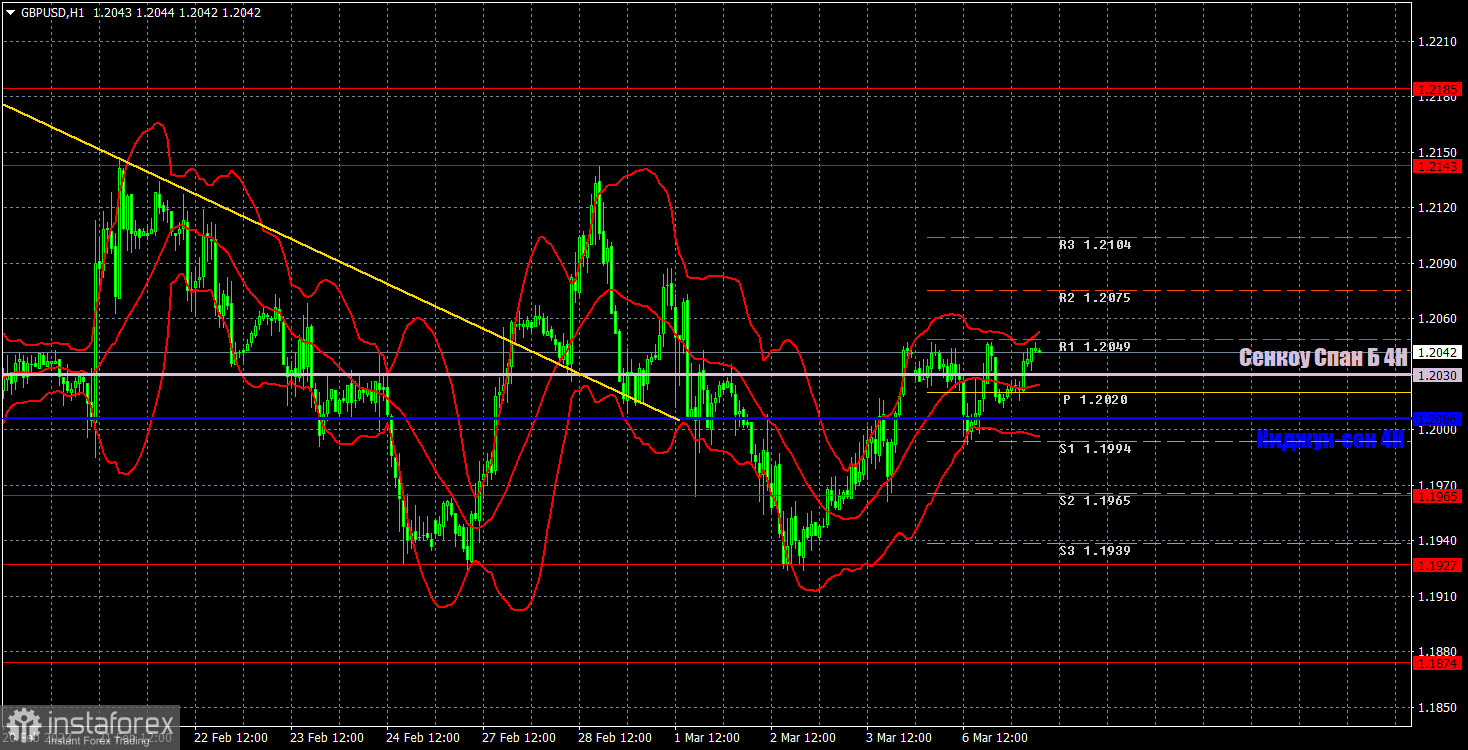
H1 chart of GBP/USD
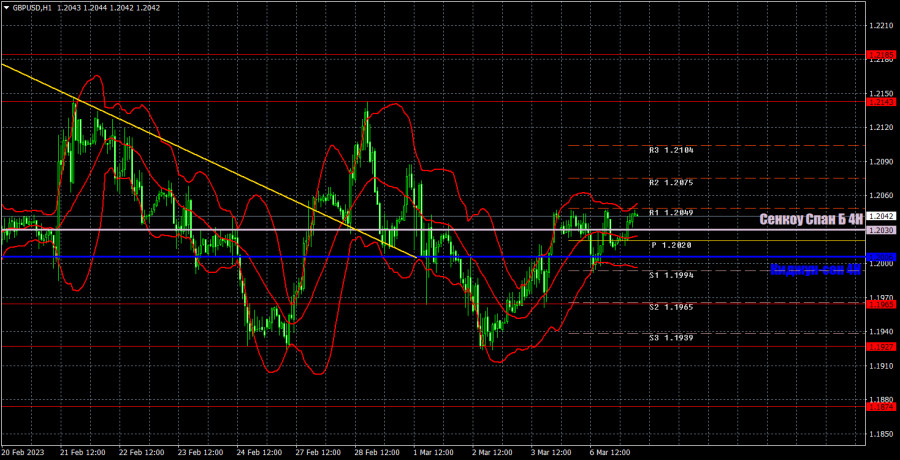
In the H1 time frame, GBP/USD keeps trading sideways, with the Ichimoku lines losing strength temporarily. After the close above the descending trend line, nothing has changed. The uptrend didn't begin. The pair failed to update its latest swing high. It remains to be seen whether it breaks through the lower limit of the sideways channel at 1.1927 as we expect a bearish continuation. On March 7, trading levels are seen at 1.1760, 1.1874, 1.1927, 1.1965, 1.2143, 1.2185, and 1.2269. Senkou Span B (1.2030) and Kijun-sen (1.2034) may also generate signals when the price either breaks or bounces off them. A Stop Loss should be placed at the breakeven point when the price goes 20 pips in the right direction. Ichimoku indicator lines can move intraday, which should be taken into account when determining trading signals. There are also support and resistance which can be used for locking in profits. On Tuesday, no interesting macro releases are scheduled in the UK. In the US, Fed Chair Powell will give testimony in the US Congress. Traders will have nothing to react to ahead of the chair's speech. Consequently, the pair will keep trading sideways.
Indicators on charts:
Resistance/support - thick red lines, near which the trend may stop. They do not make trading signals.
The Kijun-sen and Senkou Span B lines are the Ichimoku indicator lines moved to the hourly timeframe from the 4-hour timeframe. They are also strong lines.
Extreme levels are thin red lines, from which the price used to bounce earlier. They can produce trading signals.
Yellow lines are trend lines, trend channels, and any other technical patterns.
Indicator 1 on the COT chart is the size of the net position of each trader category.
Indicator 2 on the COT chart is the size of the net position for the Non-commercial group of traders.