empty
21.05.2024 03:21 AM
Outlook for EUR/USD on May 21. The euro is waiting for new buyers

Analysis of EUR/USD 5M

This image is no longer relevant

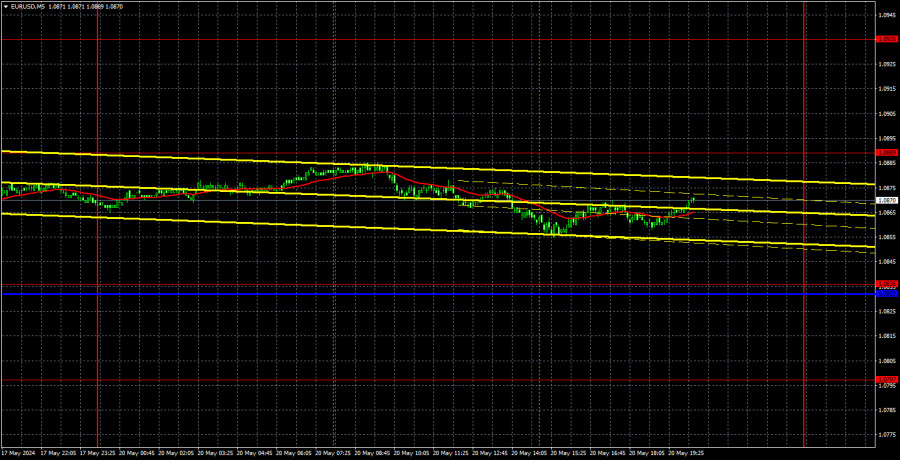
EUR/USD was unable to continue its upward movement, nor did it start a bearish correction. In general, the pair traded sideways between the levels of 1.0836 and 1.0886 all day. From our perspective, the flat phase was not unusual, but the fact that the euro cannot move away from its local highs. The market clearly showed that it is ready to buy the euro without any particular reason. So it seems that a bearish correction is not necessary. Therefore, we can probably expect a new upward movement. Perhaps the market is waiting for new macro data or fundamental events to start buying, but why? It appears that the market does not need any reasons to buy the pair right now!

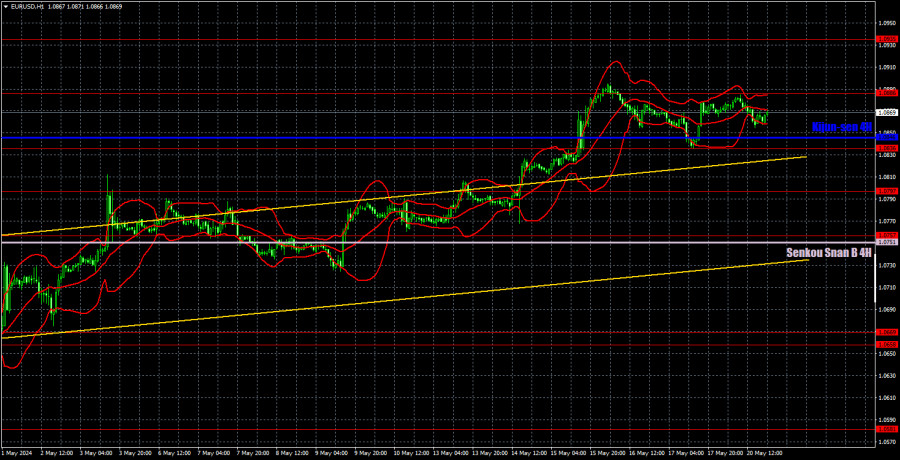
From a technical perspective, the pair is above the ascending channel and above the Ichimoku indicator lines. Therefore, there is currently no basis for expecting the end of the growth. If the price consolidates below the Kijun-sen line, then we can expect it to fall to the Senkou Span B line. However, even with such consolidation, the dollar is currently facing significant problems. The euro continues to show an illogical rise and is gaining momentum.

No trading signals were formed on Monday. The pair's volatility was a mere 30 pips, so it's a good thing that there were no signals. The pair continues to trade very sluggishly.

COT report:

This image is no longer relevant

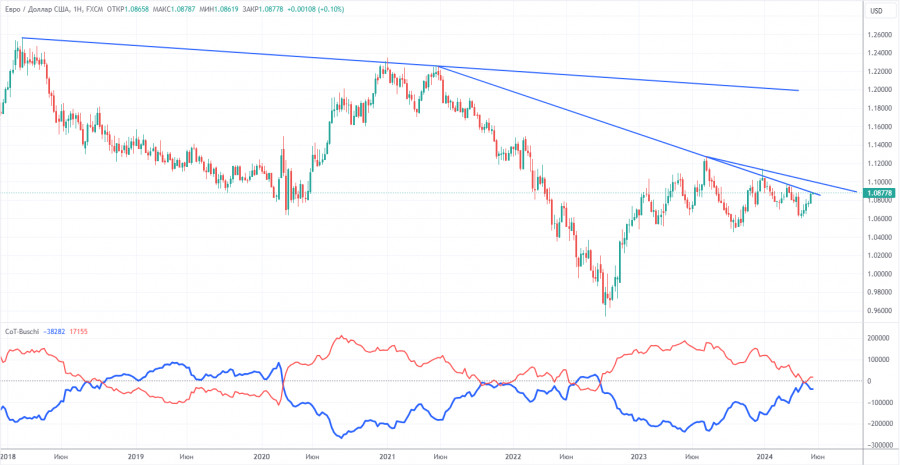
The latest COT report is dated May 14. The net position of non-commercial traders has been bullish for a long time, but now the situation has finally changed. The net position of non-commercial traders (red line) has been decreasing in recent months, while that of commercial traders (blue line) has been increasing. This shows that market sentiment is turning bearish, as speculators increasingly sell the euro. Currently, their positions coincide in terms of volume. We don't see any fundamental factors that can support the euro's strength, while technical analysis also suggests a continuation of the downtrend. Three descending trend lines on the weekly chart indicate that there's a good chance of further decline.

The red and blue lines have crossed, and now the bears might gain a significant advantage. So we strongly support the euro's decline. During the last reporting week, the number of long positions for the non-commercial group increased by 7,800, while the number of short positions decreased by 4,700. Accordingly, the net position increased by 12,500. Overall, both the euro and the net position continue to decline. The number of buy contracts is only higher than the number of sell contracts among non-commercial traders by 17,000.

Analysis of EUR/USD 1H

This image is no longer relevant

On the 1-hour chart, the EUR/USD pair has been going through a weak but steady bullish correction against the broader downtrend for a month. Since expectations for a Federal Reserve rate cut in 2024 have significantly decreased, we believe that the US currency should rise in the medium term. We still expect the price to consolidate below the ascending channel so the downtrend can resume. However, it seems that the market is not ready to buy the dollar under any circumstances, regardless of the situation. The euro simply rises almost every day, often without even having local reasons for it.

On May 21, we highlight the following levels for trading: 1.0530, 1.0581, 1.0658-1.0669, 1.0757, 1.0797, 1.0836, 1.0886, 1.0935, 1.1006, 1.1092, as well as the Senkou Span B (1.0751) and Kijun-sen (1.0846) lines. The Ichimoku indicator lines can move during the day, so this should be taken into account when identifying trading signals. Don't forget to set a Stop Loss to breakeven if the price has moved in the intended direction by 15 pips. This will protect you against potential losses if the signal turns out to be false.

On Tuesday, there are no significant events scheduled in either the Eurozone or the US. Therefore, we expect low volatility, and the euro may continue to rise or simply remain at local highs.

Description of the chart:

Support and resistance levels are thick red lines near which the trend may end. They do not provide trading signals;

The Kijun-sen and Senkou Span B lines are the lines of the Ichimoku indicator, plotted to the 1H timeframe from the 4H one. They provide trading signals;

Extreme levels are thin red lines from which the price bounced earlier. They provide trading signals;

Yellow lines are trend lines, trend channels, and any other technical patterns;

Indicator 1 on the COT charts is the net position size for each category of traders;

Paolo Greco,
Analytical expert of InstaForex
© 2007-2025
Select timeframe
5
min
15
min
30
min
1
hour
4
hours
1
day
1
week
Earn on cryptocurrency rate changes with InstaForex
Download MetaTrader 4 and open your first trade
  • Grand Choice
    Contest by
    InstaForex
    InstaForex always strives to help you
    fulfill your biggest dreams.
    JOIN CONTEST

Recommended Stories

How to Trade the GBP/USD Pair on April 15? Simple Tips and Trade Analysis for Beginners

Analysis of Monday's Trades 1H Chart of GBP/USD On Monday, the GBP/USD pair continued its upward movement without any trouble. There were no macroeconomic reasons for this, and even

Paolo Greco 06:29 2025-04-15 UTC+2

How to Trade the EUR/USD Pair on April 15? Simple Tips and Trade Analysis for Beginners

Analysis of Monday's Trades 1H Chart of EUR/USD On Monday, the EUR/USD currency pair traded more sideways than upward, although it still gained value

Paolo Greco 06:29 2025-04-15 UTC+2

Trading Recommendations and Analysis for GBP/USD on April 15: The Pound Sees No Reason to Stand Still

The GBP/USD currency pair traded higher on Monday without any "buts." While the euro showed some gains by the end of the day, they weren't significant — in contrast

Paolo Greco 03:57 2025-04-15 UTC+2

Trading Recommendations and Analysis for EUR/USD on April 15: No Boring Monday

The EUR/USD currency pair attempted to extend its growth during Monday's session but eventually pulled back in the second half of the day. In essence, we didn't see any substantial

Paolo Greco 03:57 2025-04-15 UTC+2

GBP/USD: Trading Plan for the U.S. Session on April 14th (Review of Morning Trades)

In my morning forecast, I highlighted the level of 1.3139 and planned to make trading decisions based on it. Let's look at the 5-minute chart and see what happened

Miroslaw Bawulski 18:50 2025-04-14 UTC+2

EUR/USD: Trading Plan for the U.S. Session on April 14th (Analysis of Morning Trades)

In my morning forecast, I highlighted the level of 1.1393 and planned to make entry decisions based on it. Let's look at the 5-minute chart and analyze what happened there

Miroslaw Bawulski 18:47 2025-04-14 UTC+2

How to Trade the GBP/USD Pair on April 14? Simple Tips and Trade Analysis for Beginners

Analysis of Friday's Trades 1H Chart of GBP/USD On Friday, the GBP/USD pair also continued its upward movement. The reasons are the same as for the EUR/USD pair. The entire

Paolo Greco 06:08 2025-04-14 UTC+2

How to Trade the EUR/USD Pair on April 14? Simple Tips and Trade Analysis for Beginners

Analysis of Friday's Trades 1H Chart of EUR/USD On Friday, the EUR/USD currency pair generally continued upward movement. And why would it stop? The trade war between the U.S

Paolo Greco 06:08 2025-04-14 UTC+2

Trading Recommendations and Analysis for GBP/USD on April 14: The Pound – The Silent Leader

The GBP/USD currency pair continued trading higher on Friday, although the dollar avoided substantial losses this time. Even though one day without a complete dollar collapse may seem significant

Paolo Greco 03:33 2025-04-14 UTC+2

Trading Recommendations and Analysis for EUR/USD on April 14: The Dollar Continues to Collapse

On Friday, the EUR/USD currency pair continued its ultra-strong rally—something no one was surprised by anymore. U.S. and China reciprocal tariffs continue to rise, while all other news remains irrelevant

Paolo Greco 03:33 2025-04-14 UTC+2
Can't speak right now?
Ask your question in the chat.
Widget callback
 

Dear visitor,

Your IP address shows that you are currently located in the USA. If you are a resident of the United States, you are prohibited from using the services of InstaFintech Group including online trading, online transfers, deposit/withdrawal of funds, etc.

If you think you are seeing this message by mistake and your location is not the US, kindly proceed to the website. Otherwise, you must leave the website in order to comply with government restrictions.

Why does your IP address show your location as the USA?

  • - you are using a VPN provided by a hosting company based in the United States;
  • - your IP does not have proper WHOIS records;
  • - an error occurred in the WHOIS geolocation database.

Please confirm whether you are a US resident or not by clicking the relevant button below. If you choose the wrong option, being a US resident, you will not be able to open an account with InstaForex anyway.

We are sorry for any inconvenience caused by this message.