Analysis of EUR/USD 5M
EUR/USD finally showed an interesting and relatively strong movement on Wednesday. However, we feel that this might be an exception to the rule. The average volatility remains low, and the economic reports likely weighed heavily on the US dollar. The ADP Employment report showed private employers added 150,000 jobs in June, against forecasts of over 160,000. It doesn't matter that this report usually doesn't provoke any market reaction, as NonFarm Payrolls has always been much more valued and is considered the "benchmark" among labor market indicators. Weak US Services PMI mounted pressure on the dollar, as it dropped from 53.8 points to 48.8 in June, which the market did not expect at all.
Therefore, we cannot say that the dollar did not deserve to fall on Wednesday. On the contrary, for the first time in a long while, there were specific reasons and grounds behind this movement. But at the same time, once again the market used a particular reason to buy the pair while it ignores other reasons to sell it. In the current circumstances, it is best to refer to the 24-hour TF. There, we can see that the downtrend remains intact, but in the last 7-8 months, the pair has been pretending to decline. The upward pullbacks are quite strong and frequent, so it is no longer surprising that the euro would rise within the downtrend.
Yesterday, EUR/USD formed a buy signal, which traders should have executed. The pair was showing flat dynamics during the entire European session, but in the US session, it consolidated above the critical line and the 1.0757 level, so traders could open long positions. Subsequently, the 1.0797 level was tested and the price surpassed this mark, so traders could close positions above this level. The profit was about 40 pips.
COT report:
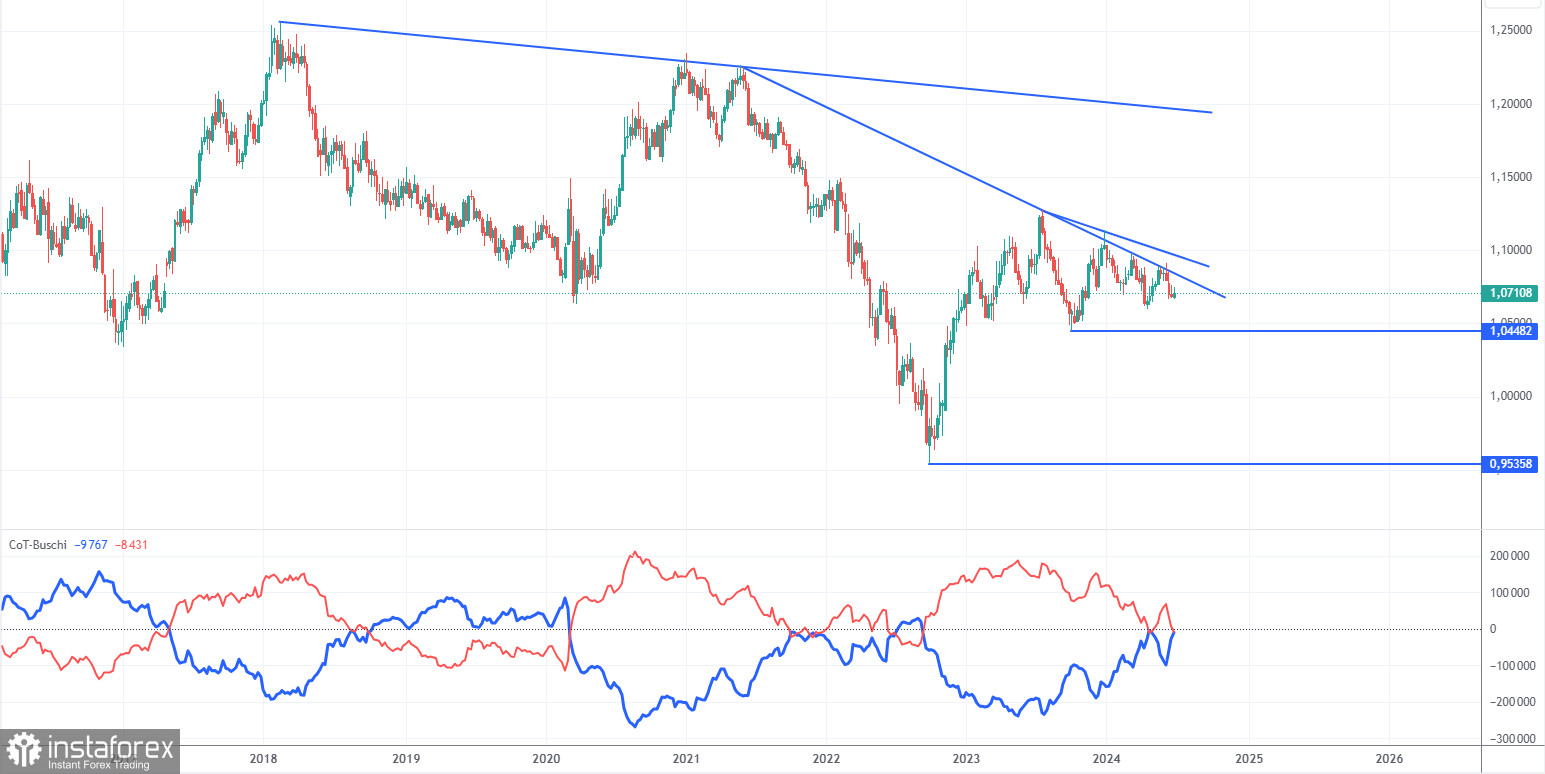
The latest COT report is dated June 25. The net position of non-commercial traders has remained bullish for a long time and remains so. The bears' attempt to gain dominance failed miserably. The net position of non-commercial traders (red line) has been declining in recent months, while that of commercial traders (blue line) has been growing. Currently, they are approximately equal, indicating the bears' new attempt to seize the initiative.
We don't see any fundamental factors that can support the euro's strength in the long term, while technical analysis also suggests a continuation of the downtrend. Three descending trend lines on the weekly chart suggests that there's a good chance of further decline. In any case, the downward trend is not broken.
Currently, the red and blue lines are approaching each other, which indicates a build-up in short positions on the euro. During the last reporting week, the number of long positions for the non-commercial group decreased by 4,100, while the number of short positions increased by 12,300. As a result, the net position decreased by 16,400. According to the COT reports, the euro still has significant potential for a decline.
Analysis of EUR/USD 1H
On the 1-hour chart, EUR/USD failed to break through the 1.0658-1.0669 area and decided not to waste time in vain, thus forming a new upward trend. At the moment, we have an ascending trend line, above which the upward trend remains. However, it may end as early as Friday if the Nonfarm Payrolls and unemployment reports in the US turn out to be better than the ADP and ISM reports.
On July 4, we highlight the following levels for trading: 1.0530, 1.0581, 1.0658-1.0669, 1.0757, 1.0797, 1.0836, 1.0889, 1.0935, 1.1006, 1.1092, as well as the Senkou Span B (1.0742) and Kijun-sen (1.0752) lines. The Ichimoku indicator lines can move during the day, so this should be taken into account when identifying trading signals. Don't forget to set a Stop Loss to breakeven if the price has moved in the intended direction by 15 pips. This will protect you against potential losses if the signal turns out to be false.
On Thursday, there are no significant events planned in either the Eurozone or the US. It's a kind of "eye of the storm" this week. America will be celebrating Independence Day, so volatility may sharply fall. We clearly do not expect strong movements today.
Description of the chart:
Support and resistance levels are thick red lines near which the trend may end. They do not provide trading signals;
The Kijun-sen and Senkou Span B lines are the lines of the Ichimoku indicator, plotted to the 1H timeframe from the 4H one. They provide trading signals;
Extreme levels are thin red lines from which the price bounced earlier. They provide trading signals;
Yellow lines are trend lines, trend channels, and any other technical patterns;
Indicator 1 on the COT charts is the net position size for each category of traders;