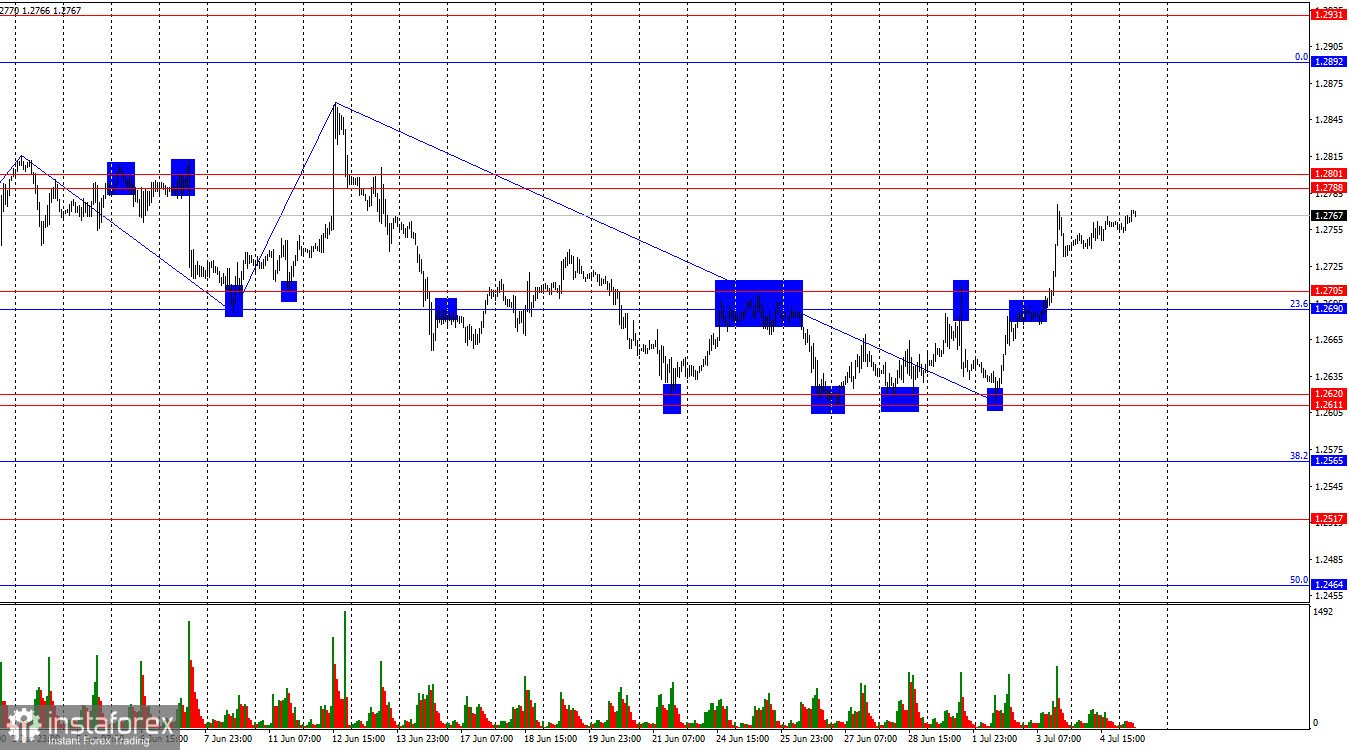
On the hourly chart, the GBP/USD pair consolidated above the resistance zone of 1.2690–1.2705 on Wednesday, marking the end of another sideways movement. On Thursday, the pair continued to rise towards the next resistance zone of 1.2788–1.2801. A rebound from this zone will favor the US dollar and lead to a decline towards the zone of 1.2690–1.2705. Securing the pair above 1.2788–1.2801 will increase the likelihood of further growth towards the next corrective level of 0.0%–1.2892.

The wave situation remains unchanged. The last upward wave broke the peak from June 4, and the last downward wave (which started forming on June 12) managed to break the low of the previous wave. Therefore, the trend for the GBP/USD pair remains "bearish." I am cautious about concluding that the trend is "bearish" because the bears still regularly show weakness, and the news often makes further attacks impossible. This week, they had to retreat due to news from the US. The "bearish" trend will officially be broken after the peak of the last upward wave from June 12 – 1.2858 – is surpassed. And the pound needs to rise by another 100 points to achieve this.
There was also no news background for the pound on Thursday. Throughout the day, the bulls launched only weak attacks, which did not lead to new growth for the pair. Today, the situation may change dramatically if the US unemployment and payroll data are stronger than forecasts. In that case, the bears can quickly return the pair to the support zone of 1.2690–1.2705. However, the failure of two more critical reports for the US economy could give the bulls the missing 100 points to break the "bearish" trend. US statistics have not been pleasing dollar bulls (they are also bears for the GBP/USD pair) for three months.
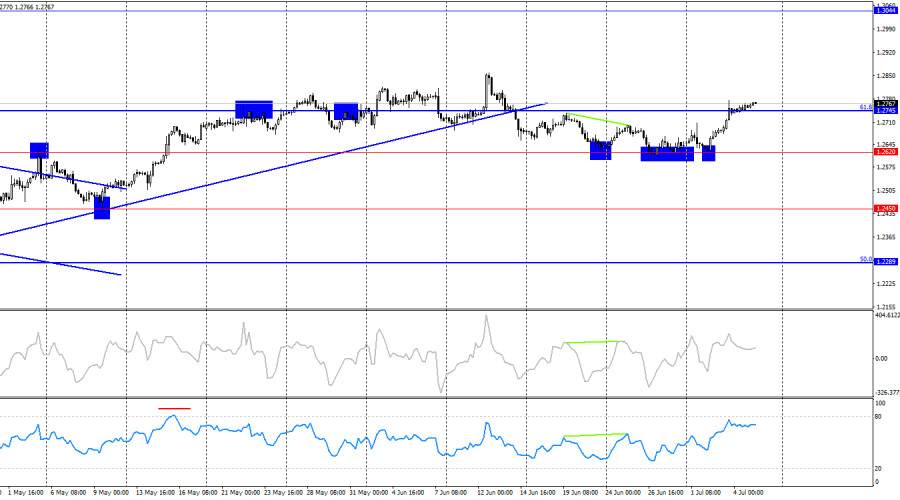
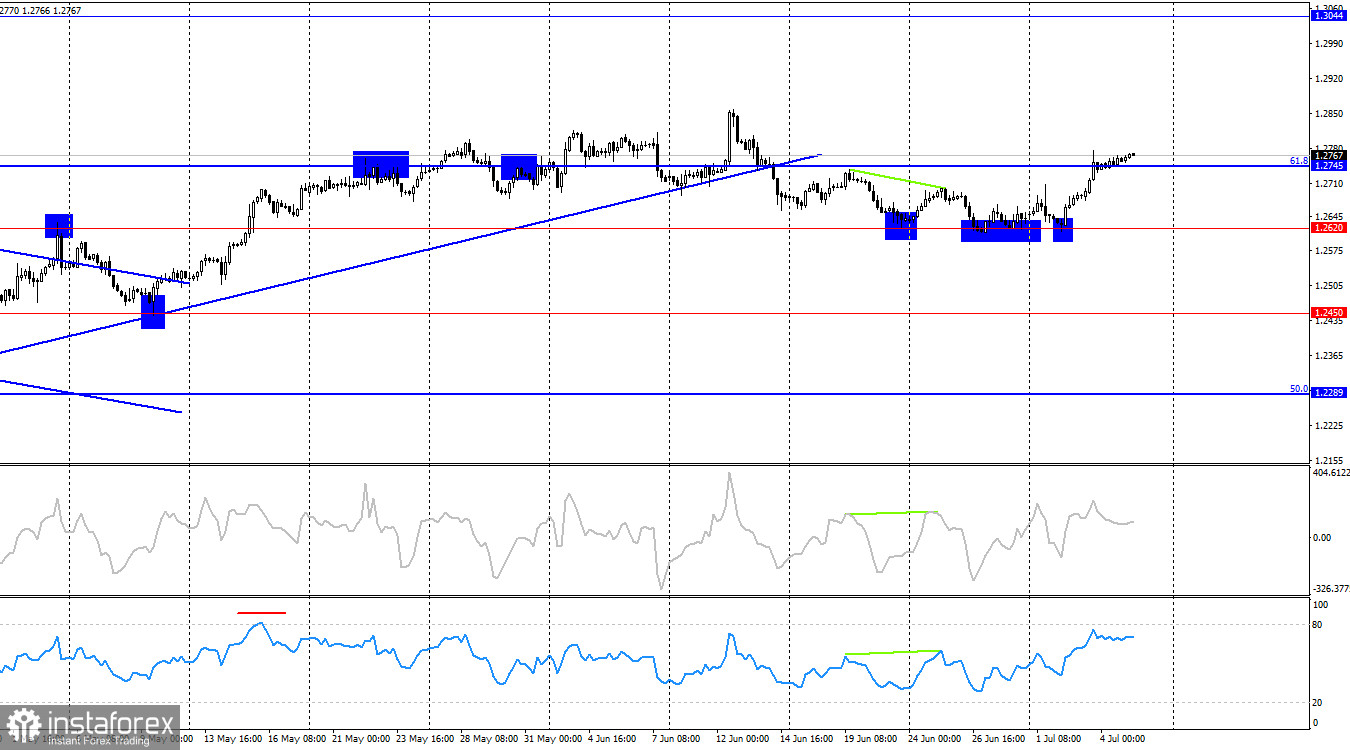
On the 4-hour chart, the pair reversed in favor of the British currency after four rebounds from the level of 1.2620. It then rose to the corrective level of 61.8%—1.2745 and secured above it. This level is not a strong obstacle. There are no obstacles to further growth for the pound until the level of 1.3044. The bears could not break even the simplest level. Currently, the pound has good graphical prospects.
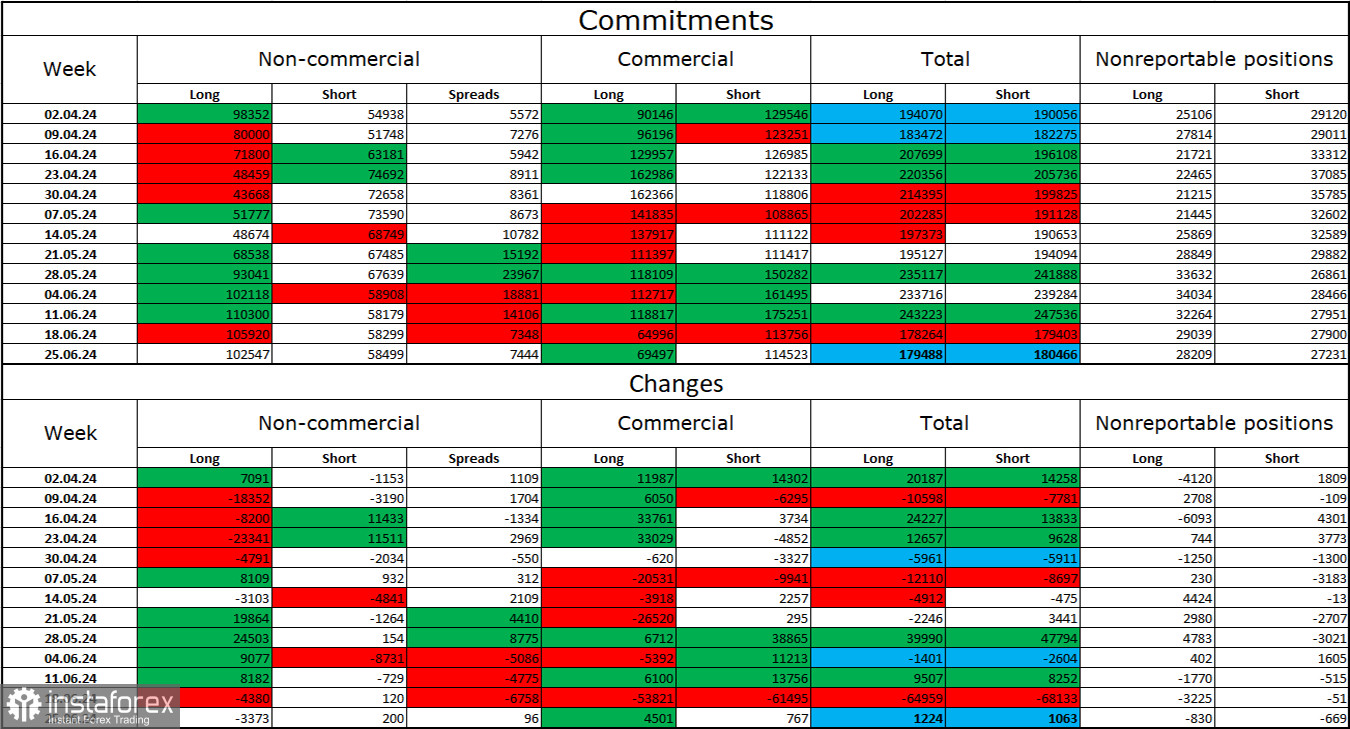
Commitments of Traders (COT) Report:
The sentiment among the "Non-commercial" trader category became slightly less "bullish" in the last reporting week. The number of long positions held by speculators decreased by 3373 units, while the number of short positions increased by 200 units. The bulls still have a solid advantage. The gap between the number of long and short positions is 44 thousand: 102 thousand against 58 thousand.
The pound still has prospects for a decline. The graphical analysis has issued several signals about the end of the "bullish" trend, and the bulls cannot attack forever. Over the past three months, the number of long positions has grown from 98 thousand to 102 thousand, and the number of short positions from 54 thousand to 58 thousand. I believe that over time, large players will continue to get rid of long positions or increase short positions because all possible factors for buying the British pound have already been worked out. However, one should remember that this is just an assumption. Graphical analysis still indicates the weakness of the bears, who cannot even "take" the level of 1.2620.
News Calendar for the US and the UK:
- US – Non-Farm Employment Change (12:30 UTC).
- US – Unemployment Rate Change (12:30 UTC).
- US – Average Hourly Earnings Change (12:30 UTC).
The economic events calendar contains three important entries on Friday. The impact of the news background on market sentiment today may be strong, but only in the second half of the day.
Forecast for GBP/USD and Trading Tips:
Selling the pound is possible after a rebound from the zone of 1.2788–1.2801 with targets at 1.2690–1.2705. Buying could have been considered after a rebound from the zone of 1.2611–1.2620 on the hourly chart with targets at 1.2690–1.2705. Then, upon closing above the zone of 1.2690–1.2705, with targets at 1.2788–1.2801. The first target has been reached, and the second is almost there.
The Fibonacci level grids are built between 1.2036 and 1.2892 on the hourly chart and 1.4248 and 1.0404 on the 4-hour chart.