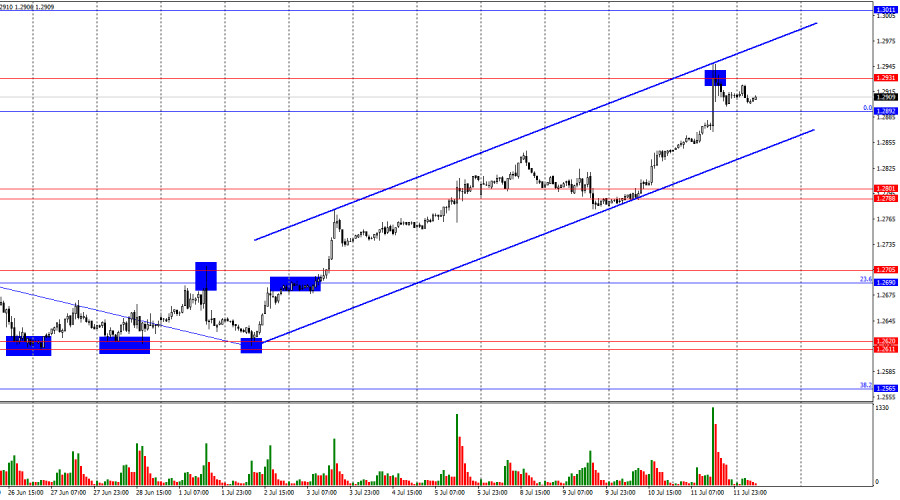
On the hourly chart, the GBP/USD pair continued its upward movement on Thursday and reached the level of 1.2931 by the end of the day. A rebound from this level suggests a possible decline towards the support zone of 1.2788–1.2801. However, at this time, I would not count too much on a strong dollar rally. The market is not only eager to sell it but also receives new information almost every day to support this. The bears have absolutely nothing to counter the bulls. Securing quotes above the level of 1.2931 will allow for expectations of a rise to the level of 1.3011.

The wave situation changed this week. The last downward wave (which has been forming since June 12) managed to break the low of the previous downward wave, and the new upward wave (which is currently forming) managed to break the peak of the previous upward wave. Thus, we received the first sign of a trend change to a "bullish" trend after the "bearish" one, which never materialized. The rise of the pound may continue, but I personally have many doubts about the sustainability of such a trend.
The background information on Thursday put even more pressure on the bears' positions. Not only did the US inflation report disappoint them, but the UK GDP report also supported the bulls. Thus, traders received a "combo" on Thursday. Despite the bulls' attacks being completely logical, I am not sure this movement will continue. First, a corrective wave is needed. Second, one should not forget that not only the Fed may start easing monetary policy in the near future, but also the Bank of England. The current rise of the pound seems like a coincidence of circumstances. The market did not expect that almost all the statistical data from the US over the past two weeks would be so dismal. Nevertheless, without signals to sell (and even better, closing below the trend corridor), selling the pair is probably not advisable.

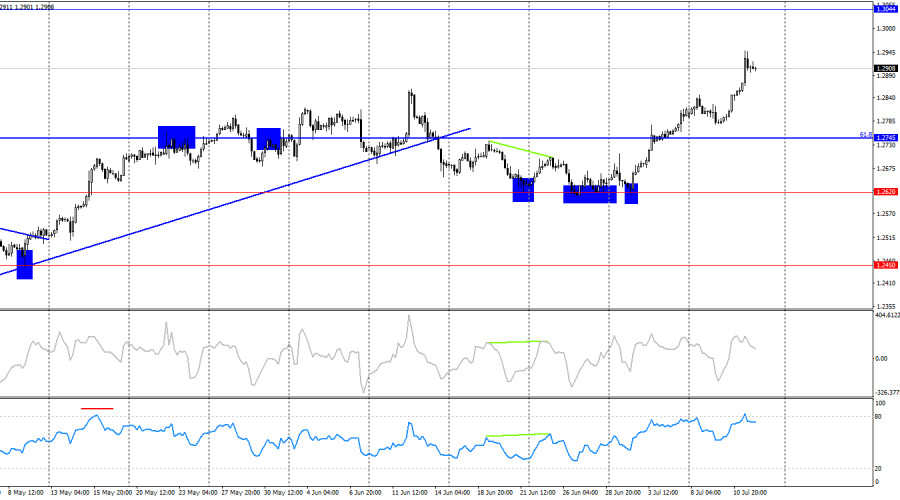
On the 4-hour chart, the pair turned in favor of the British currency after four rebounds from the level of 1.2620 and then consolidated above the corrective level of 61.8%–1.2745. Looking at the 4-hour chart, there are no obstacles to further growth of the pound up to the level of 1.3044. The bears could not even break through the simplest level. Currently, the pound has good graphical growth prospects.
Commitments of Traders (COT) Report:
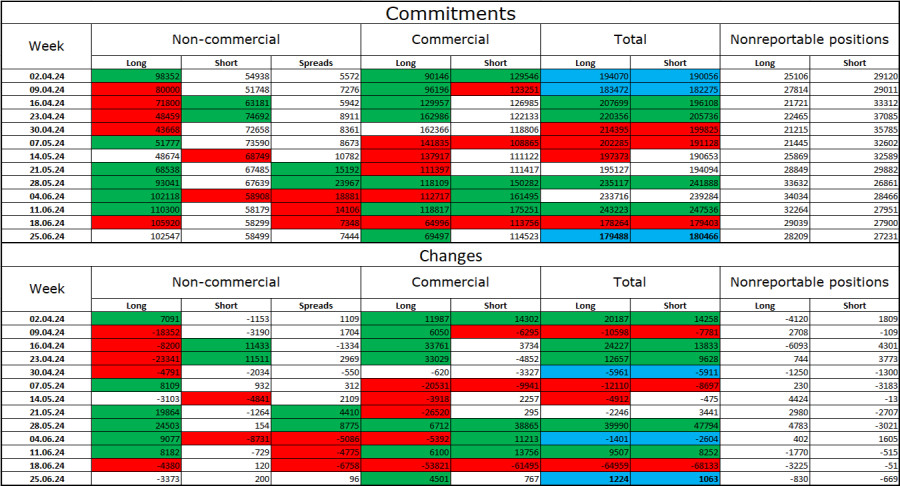
The sentiment of the "non-commercial" category of traders became slightly less "bullish" over the last reporting week. The number of long positions held by speculators decreased by 3,373 units, while the number of short positions increased by 200 units. The bulls still hold a solid advantage. The gap between the number of long and short positions is 44,000: 102,000 versus 58,000.
In my opinion, the pound still has prospects for a decline. Graphical analysis has issued several signals of a "bullish" trend reversal, and the bulls cannot attack indefinitely. Over the past 3 months, the number of long positions has increased from 98,000 to 102,000, while the number of short positions has grown from 54,000 to 58,000. I believe that over time, major players will continue to get rid of long positions or increase short positions, as all possible factors for buying the British pound have already been accounted for. However, it should be remembered that this is just an assumption. Graphical analysis still indicates the weakness of the bears, who cannot even "take" the level of 1.2620.
News calendar for the US and the UK:
USA – Producer Price Index (12:30 UTC).
USA – University of Michigan Consumer Sentiment Index (14:00 UTC).
On Friday, the economic event calendar includes several entries for America. The influence of the information background on market sentiment may be present today, but I think it will be weak.
Forecast for GBP/USD and advice to traders:
Selling the pound is possible today upon a rebound from the level of 1.2931 on the hourly chart, with the target being the lower boundary of the ascending corridor. Purchases could be considered yesterday upon consolidation above the zone of 1.2788–1.2801 with the target of 1.2892. This target was achieved. New purchases can be made upon closing above the level of 1.2931.
Fibonacci levels are built from 1.2036–1.2892 on the hourly chart and from 1.4248–1.0404 on the 4-hour chart.


