Analyzing Thursday's trades:
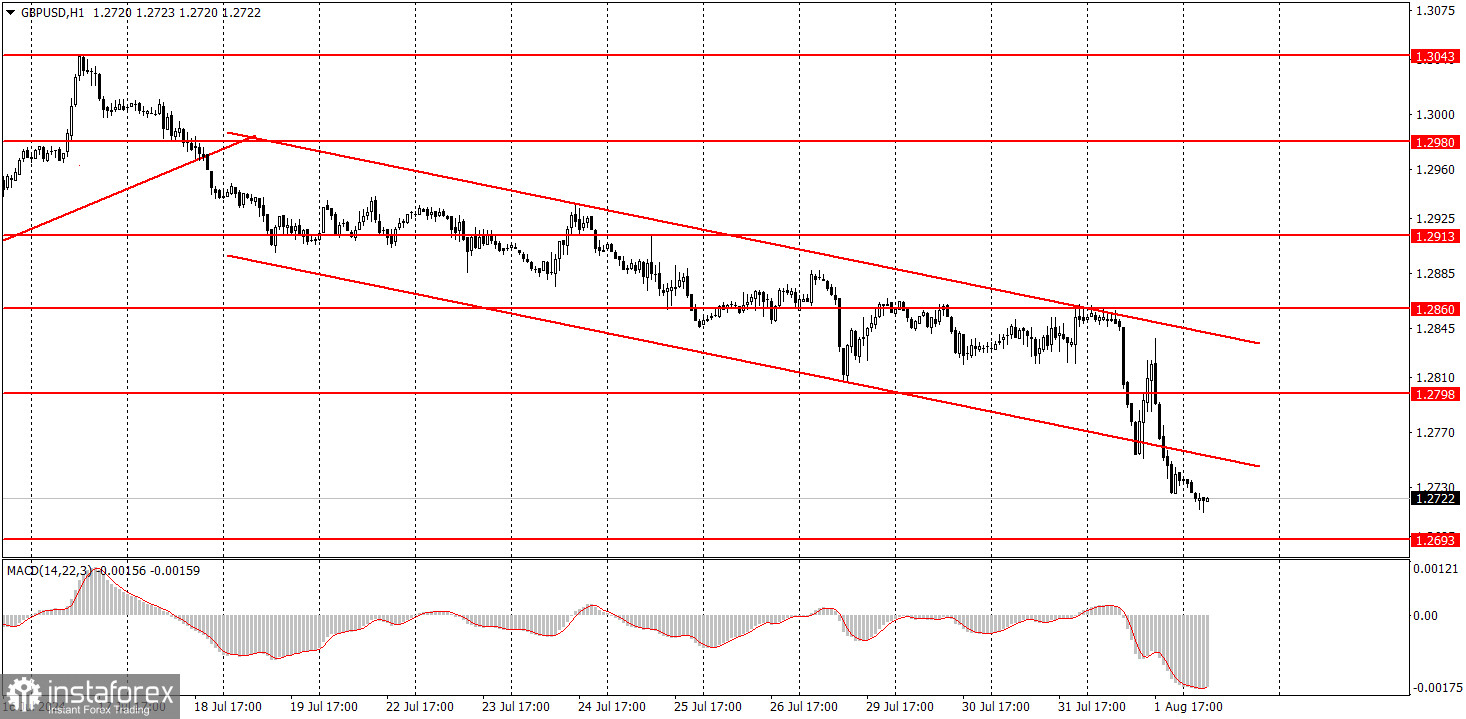
GBP/USD on 1H chart
On Thursday, the GBP/USD pair sustained its decline and finally showed good volatility. The pair moved about 140 pips during the day. Given the Bank of England's decision to cut rates, this decline is likely logical. It seems the market was completely unprepared for such an outcome, although we've repeatedly mentioned that it was oddly expecting a rate cut only from the U.S.. The market has been waiting in vain for about seven months, trading as if the Federal Reserve had already eased monetary policy several times. Yesterday, it became clear that the European Central Bank and the BoE would begin monetary easing before the U.S. central bank. Whether the Fed will start cutting rates by September remains an open question. We do not share the market's newfound optimism about monetary easing. In our opinion, the current level of inflation does not support rate cuts in September. Therefore, the dollar may continue to rise steadily.
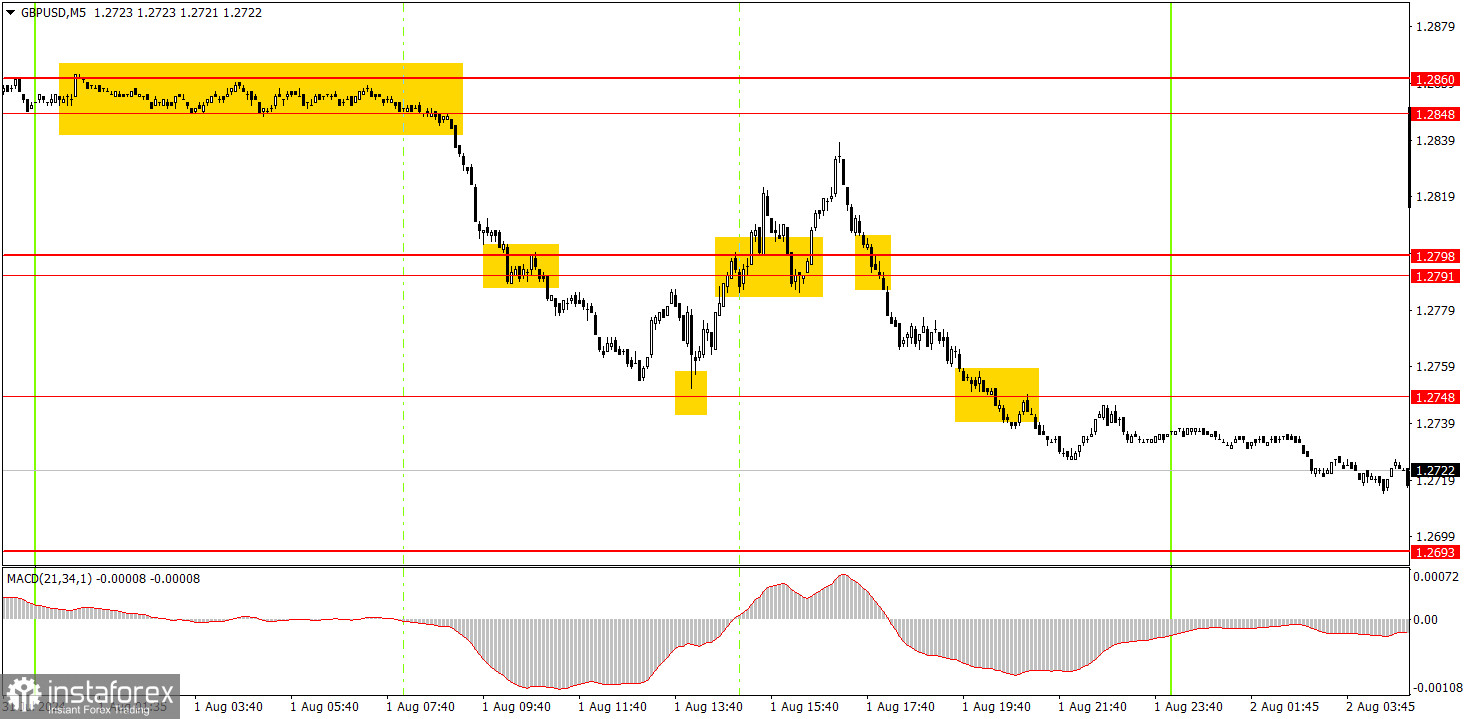
GBP/USD on 5M chart
Several signals were formed in the 5-minute time frame on Thursday. We want to point out that six signals were immediately formed when the pair showed good volatility. The first sell signal around the 1.2848-1.2860 area resulted in excellent profit. The price fell and approached the 1.2748 level with a 3-pip deviation. A rebound from this level could have been used to open long positions. These should have been closed based on a sell signal around the 1.2791-1.2798 area, and new short positions could have been opened on the same signal. By the end of the day, the pair fell by another 45 pips. In total, about 125 pips could have been earned from the three trades.
Trading tips on Friday:
GBP/USD has a good chance of continuing its downward trend in the hourly time frame. The British pound is still overbought, the dollar is undervalued, and the BoE has started lowering its borrowing costs—what more is needed for the British currency to keep falling? Of course, economic reports from the U.S. could spoil the ideal scenario for the dollar, but we hope the market is now inclined to buy the dollar rather than sell it.
On Friday, novice traders might stay in short positions, but there will be important U.S. data during the American session, so be prepared for a potential upward reversal.
The key levels to consider on the 5M timeframe are 1.2605-1.2633, 1.2684-1.2693, 1.2748, 1.2791-1.2798, 1.2848-1.2860, 1.2913, 1.2980-1.2993, 1.3043, 1.3102-1.3107, and 1.3145. Today, no significant events are scheduled in the UK, but in the U.S., reports on unemployment, the labor market, and wages will be released.
Basic rules of a trading system:
1) The strength of a signal is determined by the time it took for the signal to form (bounce or level breakthrough). The shorter the time required, the stronger the signal.
2) If two or more trades around a certain level are initiated based on false signals, subsequent signals from that level should be ignored.
3) In a flat market, any currency pair can produce multiple false signals or none at all. In any case, it's better to stop trading at the first signs of a flat market.
4) Trades should be opened between the start of the European session and mid-way through the U.S. session. All trades must be closed manually after this period.
5) In the hourly time frame, trades based on MACD signals are only advisable amidst substantial volatility and an established trend, confirmed either by a trendline or trend channel.
6) If two levels are too close to each other (from 5 to 20 pips), they should be considered as a support or resistance zone.
7) After moving 15 pips in the intended direction, the Stop Loss should be set to break-even.
What's on the charts:
Support and Resistance price levels can serve as targets when buying or selling. You can place Take Profit levels near them.
Red lines represent channels or trend lines that depict the current trend and indicate the preferred trading direction.
The MACD (14,22,3) indicator, encompassing both the histogram and signal line, acts as an auxiliary tool and can also be used as a source of signals.
Important speeches and reports (always noted in the news calendar) can profoundly influence the price dynamics. Hence, trading during their release calls for heightened caution. It may be reasonable to exit the market to prevent abrupt price reversals against the prevailing trend.
Beginners should always remember that not every trade will yield profit. Establishing a clear strategy, coupled with effective money management, is key to long-term success in trading.