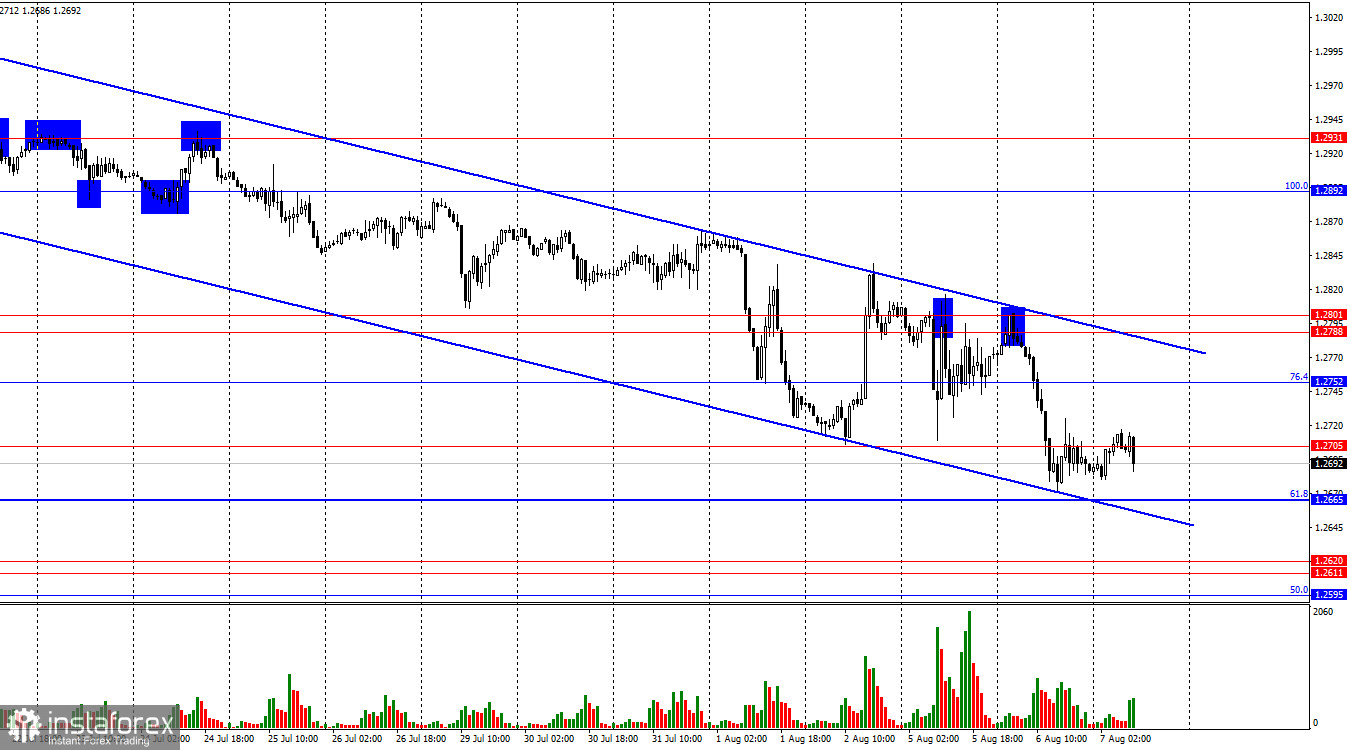
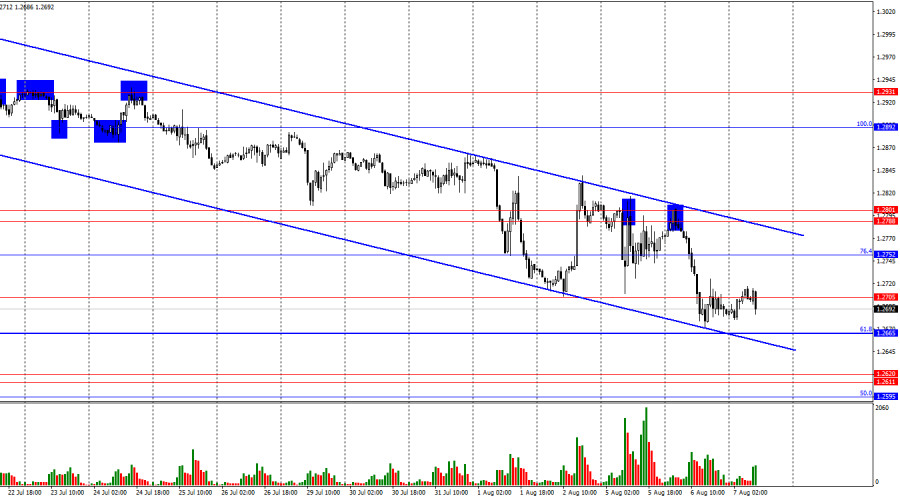
On the hourly chart, the GBP/USD pair on Tuesday rebounded from the resistance zone of 1.2788–1.2801 and reversed in favor of the US dollar, falling to the lower line of the downward trend channel. At the moment, there are no new signals indicating a continuation of the decline or a reversal. A further drop to the 61.8% retracement level at 1.2665 is possible. A rebound from this level could signal a reversal in favor of the pound and some growth towards the levels of 1.2709 and 1.2752.
The wave situation has changed slightly, with the last completed upward wave (which started forming on July 2) breaking the low of the previous upward wave, while the last downward wave has not yet broken the low of the previous downward wave. Currently, we are dealing with a "bullish" trend and a deep corrective wave or series of waves. The growth of the pound may resume. A shift to a "bearish" trend is not yet indicated from a wave perspective. For this to occur, the pair needs to break the previous low from July 2. However, the waves are now very long, and in recent weeks the pound has only been falling. Locally, the trend is "bearish."
The information background on Tuesday did not indicate any negative outcomes for the pound, but an important aspect is its disregard for the general market noise. The U.S. dollar has been losing ground against the euro and many other currencies in recent days, but it continues to rise steadily against the pound. In my view, the market realizes that the Fed may start easing monetary policy in September, while the Bank of England has already started cutting rates. It may continue to cut them at nearly every subsequent meeting, as inflation in the UK is at 2%, and now the Bank of England needs to ensure it does not fall too low. As for the Fed, the whole fuss about a possible recession is unclear to me. The GDP report for the second quarter clearly showed strong growth in the U.S. economy. Therefore, I believe that the GBP/USD pair is falling logically, unlike the EUR/USD pair.
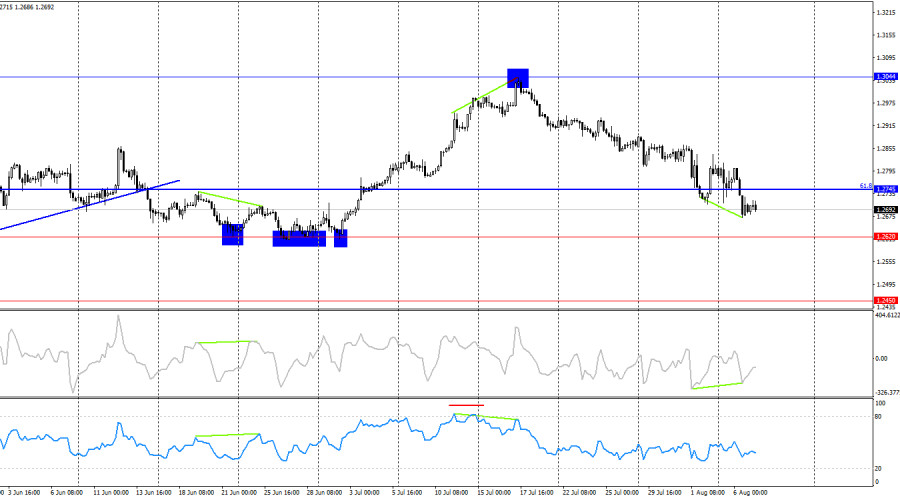
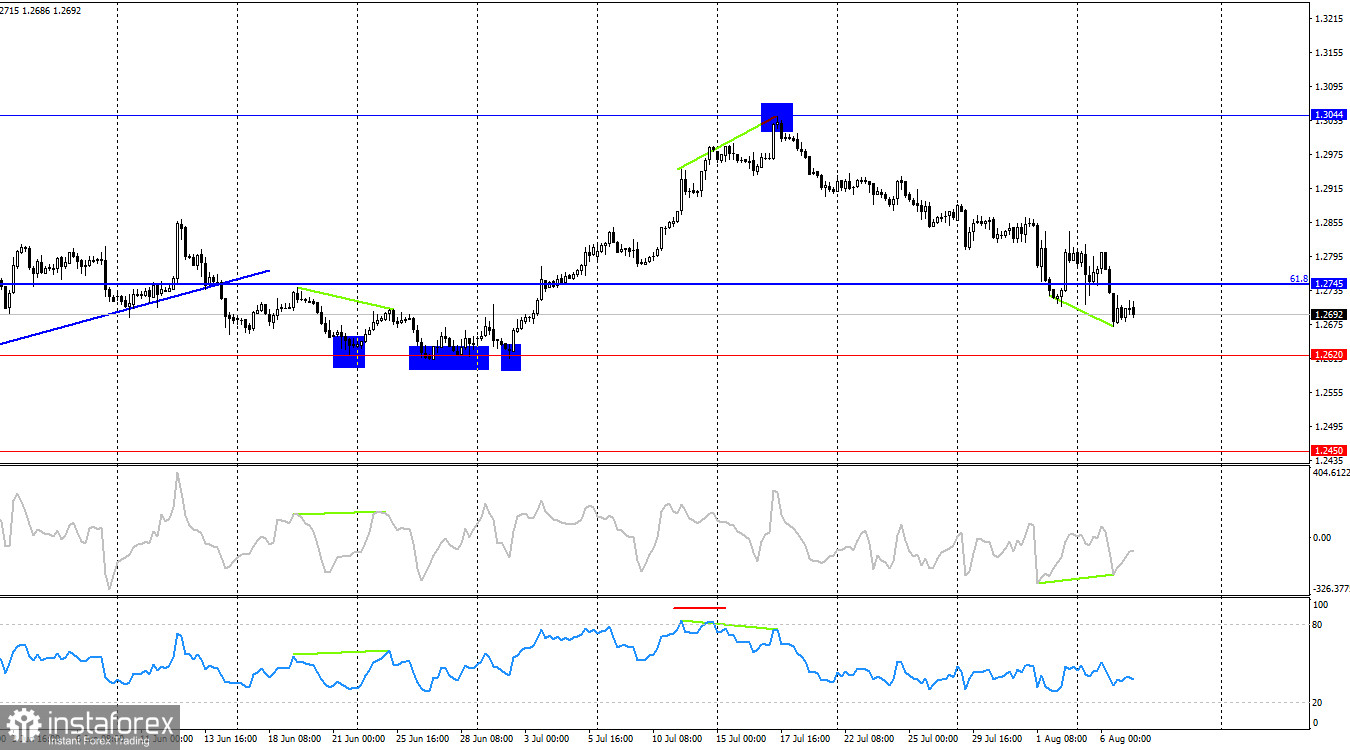
On the 4-hour chart, the pair settled below the 61.8% retracement level at 1.2745. This allows for a continuation of the decline towards the next level at 1.2620. A "bullish" divergence has now formed on the CCI indicator, which could temporarily halt the pound's decline. On the hourly chart, strong growth should be expected after the pair settles above the descending trend channel.
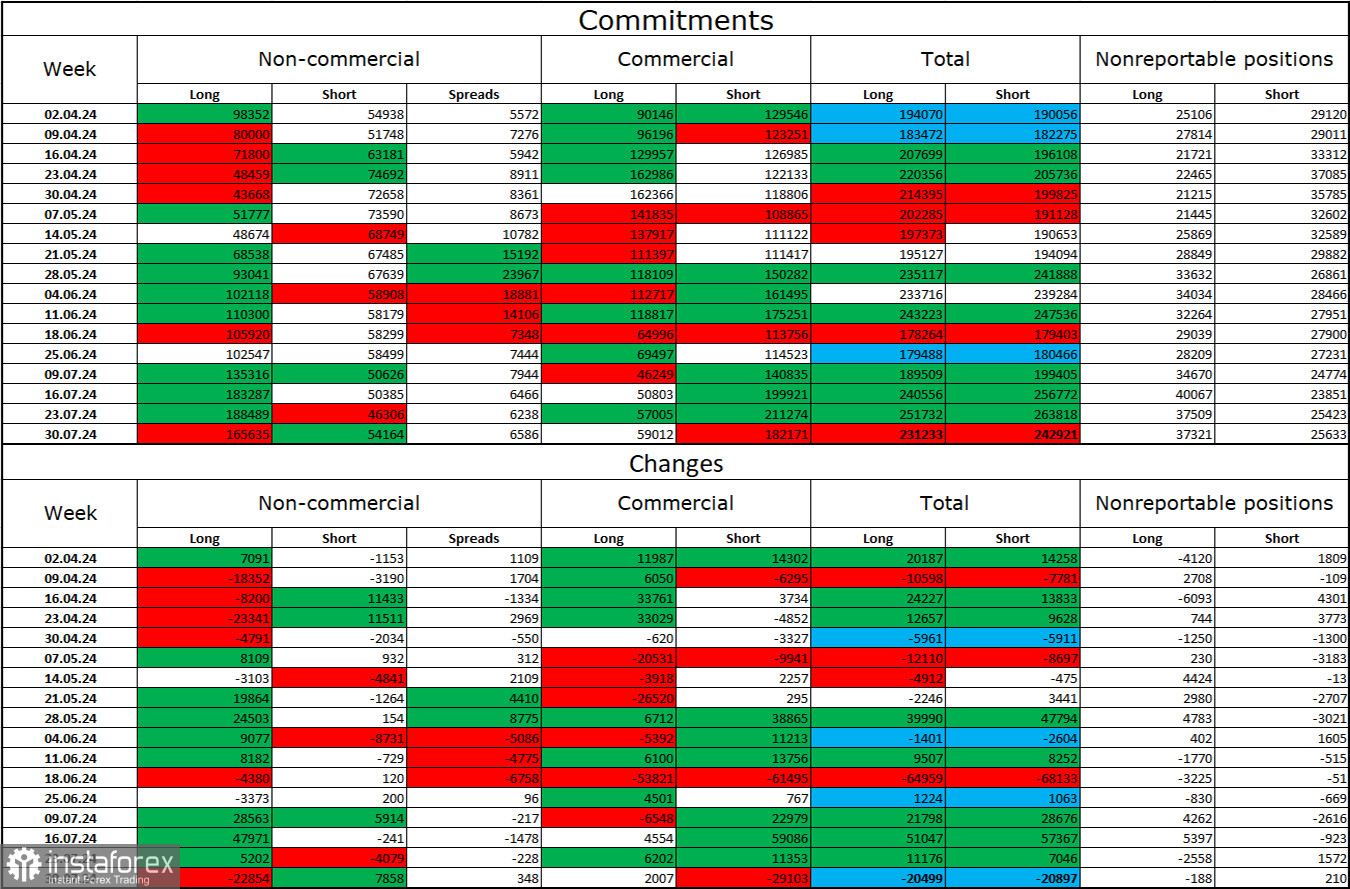
Commitments of Traders (COT) Report:
The sentiment of the "Non-commercial" category of traders has become less "bullish" over the past reporting week. The number of long positions held by speculators decreased by 22,854, while the number of short positions increased by 7,858. Bulls still hold a solid advantage. The gap between the number of long and short positions is now 111 thousand: 165 thousand against 54 thousand.
In my opinion, the prospects for the pound to fall remain, but the COT reports still suggest otherwise. Over the past 3 months, the number of long positions has increased from 98 thousand to 165 thousand, while the number of short positions has remained unchanged at 54 thousand. I believe that over time, professional players will start to shed long positions or increase short positions, as all possible factors for buying the British pound have already been exhausted. However, this is just an assumption. Graphical analysis suggests a likely decline in the near future, but this does not mean that the fall will last several months or half a year.
Economic Calendar for the U.S. and U.K.:
On Tuesday, the economic calendar contains no entries. The impact of the information background on market sentiment will be absent today.
Forecast for GBP/USD and Trader Recommendations:
The market started the new week very nervously. Yesterday and today, it was possible to use rebounds on the hourly chart from the resistance zone of 1.2788–1.2801. The targets for the fall at 1.2709 and 1.2665 were almost fully worked out. I consider purchases possible after the quotes settle above the descending channel.
Fibonacci levels are built at 1.2892–1.2298 on the hourly chart and at 1.4248–1.0404 on the 4-hour chart.