Analyzing Thursday's Trades:
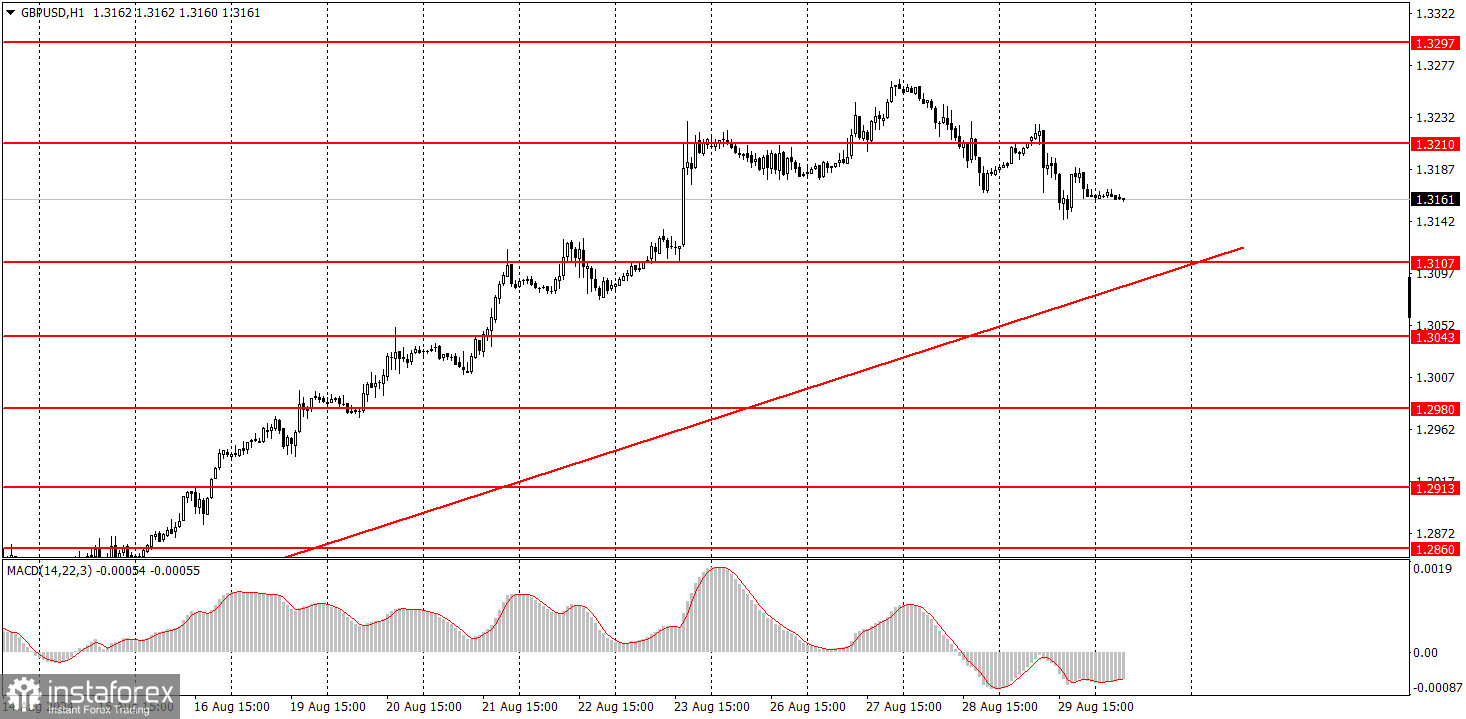
GBP/USD on 1H Chart
On Thursday, the GBP/USD pair also sustained its downward movement, but it was so weak that it hardly merits discussion. In short, the British pound is extremely overbought and unreasonably expensive. It has risen for three consecutive weeks without corrections, and the market continues to price in only the future easing of the Federal Reserve's monetary policy. Thus, we can only consider a decline in the British currency under current circumstances. However, the price has yet to reach the trend line. Whether it will surpass it is unknown. On Thursday, the second estimate of the US GDP report for the second quarter was pleasantly surprising again, with the American economy growing by 3%, contrary to the +2.8% forecast. Therefore, we believe the dollar should have strengthened much more yesterday. But what can we do if the dollar did rise on the report but fell before and after it?
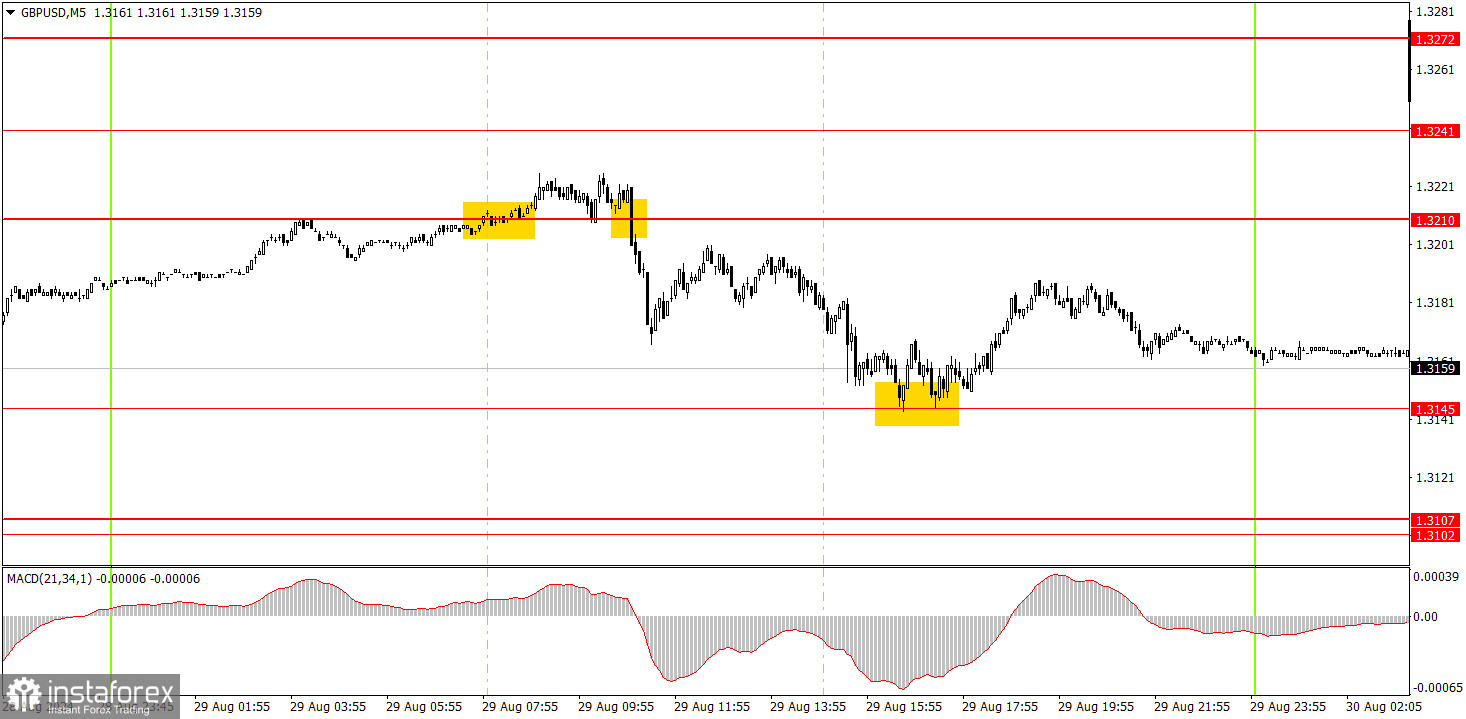
GBP/USD on 5M Chart
Several interesting trading signals were formed in the 5-minute time frame on Thursday. The first buy signal around the 1.3210 level should have been ignored, as the nearest target, 1.3241, was too close. However, the next sell signal around the 1.3210 level should have been executed. Subsequently, the price reached the 1.3145 level and bounced off it. Here, short positions should have been closed for a profit of about 40 pips, and long positions could have been opened in anticipation of a corrective rebound. Another 10-20 pips could have been earned on this trade.
How to Trade on Friday:
In the hourly time frame, GBP/USD has a good chance of resuming the global downward trend, but a strong local uptrend is currently in progress. The British pound remains overbought, the dollar is undervalued, and the market continues to use every opportunity to buy the British currency and sell the dollar. It ignores all unfavorable reports and events. Even if there is no news, the market might continue purchasing the pair.
On Friday, the pair might continue to move downward, as the trend line now acts as a magnet. However, a collapse of the pair is unlikely.
The key levels to consider on the 5M timeframe are 1.2605-1.2633, 1.2684-1.2693, 1.2748, 1.2791-1.2798, 1.2848-1.2860, 1.2913, 1.2980-1.2993, 1.3043, 1.3102-1.3107, 1.3145, 1.3210, 1.3241, 1.3272, and 1.3310. On Friday, no interesting reports are scheduled to be released in the UK, while in the US, the PCE indexes and consumer sentiment from the University of Michigan will be published. Therefore, in the afternoon, there may be reversals and increased volatility.
Basic Rules of the Trading System:
1) The strength of a signal is determined by the time it takes for the signal to form (bounce or level breakthrough). The less time it took, the stronger the signal.
2) If two or more trades around a certain level are initiated based on false signals, subsequent signals from that level should be ignored.
3) In a flat market, any currency pair can form multiple false signals or none at all. In any case, it's better to stop trading at the first signs of a flat market.
4) Trades should be opened between the start of the European session and midway through the U.S. session. After this period, all trades must be closed manually.
5) In the hourly time frame, trades based on MACD signals are only advisable amidst substantial volatility and an established trend confirmed by a trendline or trend channel.
6) If two levels are too close to each other (5 to 20 pips), they should be considered support or resistance.
7) After moving 20 pips in the intended direction, the Stop Loss should be set to break even.
What's on the Charts:
Support and Resistance price levels: targets for opening long or short positions. You can place Take Profit levels near them.
Red lines: channels or trend lines that depict the current trend and indicate the preferred trading direction.
The MACD (14,22,3) indicator, encompassing both the histogram and signal line, acts as an auxiliary tool and can also be used as a source of signals.
Important speeches and reports (always noted in the news calendar) can profoundly influence the movement of a currency pair. Hence, trading during their release calls for heightened caution. It may be reasonable to exit the market to prevent abrupt price reversals against the prevailing trend.
Beginners should always remember that not every trade will yield profit. Developing a clear strategy and effective money management is key to success in trading over a long period.