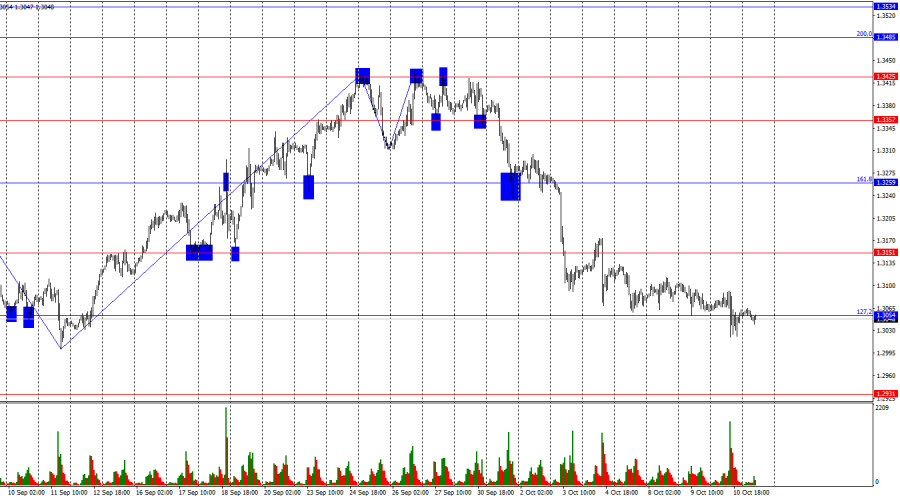
On the hourly chart, the GBP/USD pair remained around the 127.2% corrective level at 1.3054 on Thursday and even consolidated below it. However, today, the quotes have begun recovering following the release of economic data from the UK. Conversely, yesterday, the pair was under pressure due to U.S. inflation data. The British pound could start to rise soon, though this is unlikely to occur today. The target is the 1.3151 level.
The wave structure is clear and straightforward. The last completed upward wave (on September 26) did not break the peak of the previous wave, while the current downward wave, which has been forming for 12 days, easily broke the low of the previous wave, located at the 1.3311 level. Thus, the bullish trend is considered over, and a bearish trend has begun to form. From the 1.3054 level, I expect a corrective upward wave.
On Friday morning, economic data was released in the UK, but I can't consider it entirely positive. GDP in August grew by 0.2% m/m, as traders expected, but overall, the UK economy's growth remains sluggish, with Q2 showing only a 0.5% increase, below forecasts. Industrial production volumes increased by 0.5% m/m, compared to a forecast of +0.2% m/m, but is this significant given that the annual figure has been declining for 11 consecutive months? Despite this rare monthly increase, the overall trend remains downward. Therefore, while the pound received some support from traders, it is unlikely to be strong. On the other hand, the pound has been falling for 12 days straight with minimal corrections. An upward correction is quite possible, but this would be more for technical reasons than due to the information released today and yesterday. In any case, I would approach buying with caution, as the pound may only form a corrective wave. Given the strength of the bears in recent weeks, the corrective wave could be quite weak.

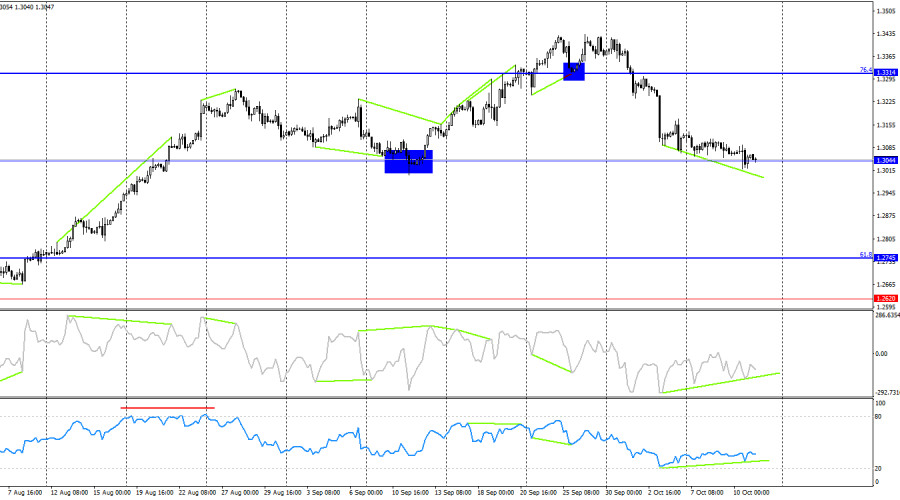
On the 4-hour chart, the pair has fallen to the 1.3044 level. Bullish divergence has been forming on both indicators for over a week, signaling a potential rebound from the 1.3044 level. A rebound from this level may indicate a minor upward movement, but a significant rise in the pound's value is unlikely. A consolidation below 1.3044 would open the path for further declines toward the 61.8% Fibonacci level at 1.2745.
Commitments of Traders (COT) Report:
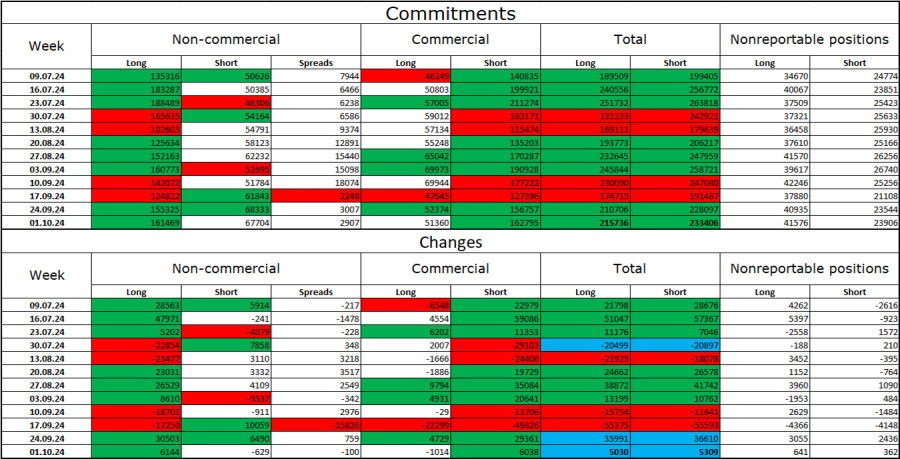
The sentiment of the "Non-commercial" category of traders became more bullish over the past week. The number of long positions held by speculators increased by 6,144, while the number of short positions decreased by 629 units. After two weeks of reducing long positions and increasing short ones, professional players have returned to buying the pound. Bulls still maintain a dominant position. The gap between the number of long and short positions is 93,000: 161,000 long positions versus 68,000 short.
In my opinion, the pound still has downside potential, but the COT reports currently suggest otherwise. Over the past three months, the number of long positions has increased from 135,000 to 161,000, while the number of short positions has risen from 50,000 to 68,000. I believe that over time, professional players will begin to shed long positions or increase short positions, as most factors favoring the pound have already been priced in. Technical analysis indicates that this process may begin in the near future.
News Calendar for the UK and the U.S.:
- UK: GDP Growth Change for August (06:00 UTC).
- UK: Industrial Production Change (06:00 UTC).
- U.S.: Producer Price Index (12:30 UTC).
- U.S.: University of Michigan Consumer Sentiment Index (14:00 UTC).
Friday's economic calendar includes two key reports, both with similar potential to influence market sentiment. The impact of the news background on the market's mood today is likely to be moderate.
Forecast for GBP/USD and Trading Tips:
Selling the pair was possible after the rebound from the 1.3425 level on the hourly chart, with targets at 1.3357, 1.3259, 1.3151, and 1.3054. All targets have been achieved. I think it's time to close sales. New sales can be considered if the pair closes below 1.3044, targeting 1.2931, preferably after a correction. Buying may be considered after a rebound from the 1.3044 level on the 4-hour chart, with a target of 1.3151.
Fibonacci levels are built between 1.2892 – 1.2298 on the hourly chart and 1.4248 – 1.0404 on the 4-hour chart.


