GBP/USD 5M Analysis:
On Friday, the GBP/USD currency pair continued to trend downward. Volatility remains low, with the price gradually declining nearly every day. The British pound has fallen significantly over the past two weeks. However, this doesn't necessarily indicate that a rebound is imminent. It is important to remember that the pound remains extremely overbought and unjustifiably expensive. However, this doesn't guarantee that it will continue to decline for an extended period. We still believe that a small upward correction is necessary before resuming the downtrend, which could persist in the medium term.
The British currency could face renewed downward pressure this week with the release of the inflation report. It is expected that all forms of inflation in the UK will slow for September. If this slowdown is more pronounced than currently forecasted, it could act as a catalyst for the GBP/USD pair to resume its decline. The Bank of England has only lowered rates once and has shown no indication of resuming monetary easing anytime soon. However, this implies that the BoE may need to reduce rates more sharply and quickly in the future than it could now.
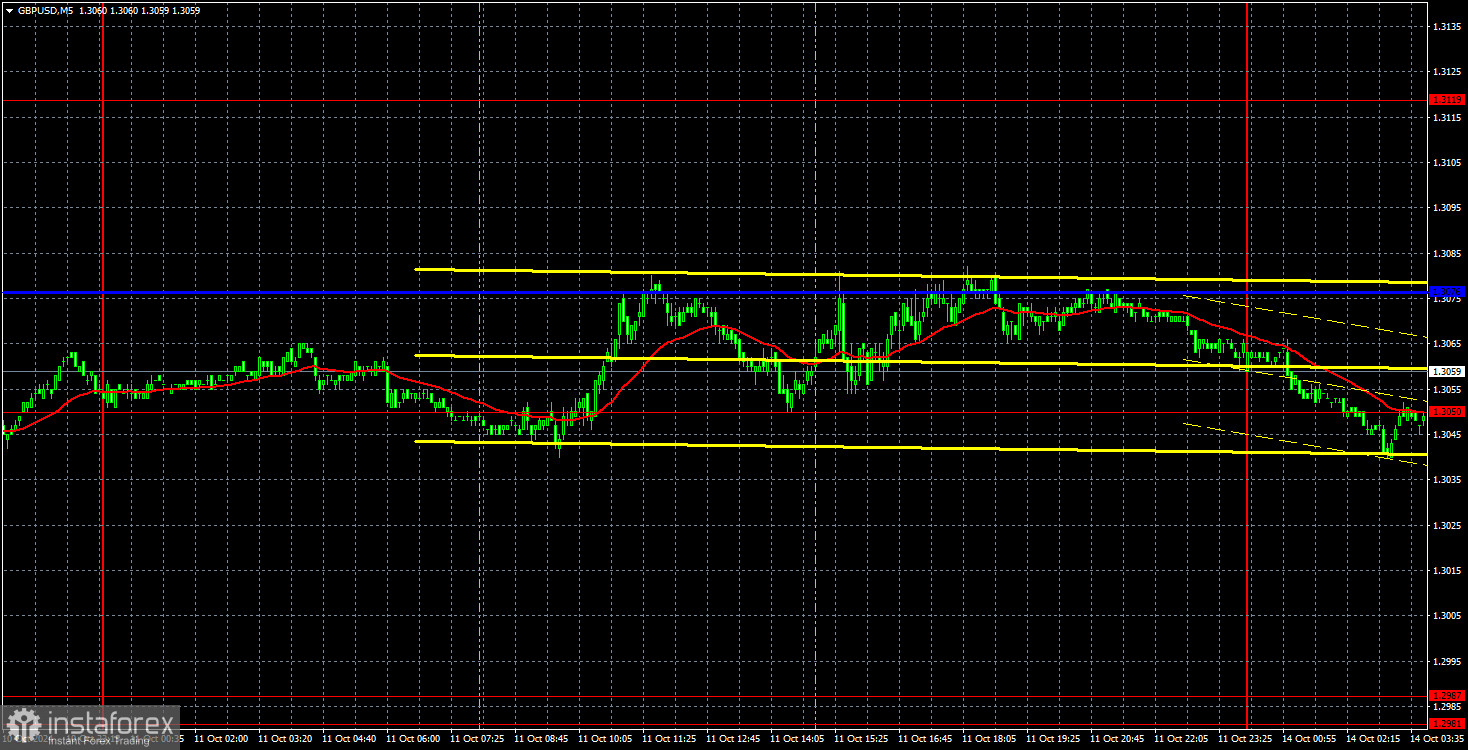
On Friday, the price tested the critical Kijun-sen line four times on the 5-minute time frame (TF). However, as mentioned earlier, volatility was extremely low. While it was possible to attempt to trade these signals, expecting a significant profit in such low volatility was unlikely. However, a profit of 10-20 points could have been made. This week won't bring much more significant news than last week, but a few key drivers remain.
COT Report:
The COT (Commitments of Traders) reports on the British pound show that the sentiment among commercial traders has fluctuated constantly in recent years. The red and blue lines, representing the net positions of commercial and non-commercial traders, frequently intersect and are often close to the zero mark. We also see that the most recent downward trend coincided with the period when the red line was below zero. Currently, the red line is above zero, and the price has broken through the important level of 1.3154.
According to the latest report on the British pound, the "Non-commercial" group opened 6.1 thousand buy positions and closed 0.6 thousand sell positions. As a result, the net position of non-commercial traders increased by 6.7 thousand positions for the week. The pound continues to be bought by market participants.
The fundamental backdrop still provides no rationale for long-term purchases of the pound, and the currency has a real chance of resuming its global downtrend. However, on the weekly time frame (TF), there is an established upward trend line. Until this trend line is breached, a long-term decline in the pound is unlikely. The pound continues to rise despite almost all odds, and even when COT reports show that large players are selling the pound, it still rises.
GBP/USD 1H Analysis:
In the hourly time frame, the GBP/USD pair continues its strong decline. The upward trend has been canceled, so we now expect only a strong and prolonged fall in the British currency. Of course, the market could still resume unjustified buying of the British currency, but let us remind you again—there are no fundamental or macroeconomic reasons for this. Thus, we continue to advocate for downward movement, but in the near term, the pair may correct upward.
For October 14, we highlight the following important levels for trading: 1.2796-1.2816, 1.2863, 1.2981-1.2987, 1.3050, 1.3119, 1.3175, 1.3222, 1.3273, 1.3367, 1.3439. The Senkou Span B lines (1.3246) and Kijun-sen (1.3065) can also serve as signal sources. It is recommended to place a Stop Loss at breakeven if the price moves 20 points in the correct direction. The Ichimoku indicator lines may move throughout the day, so this should be considered when identifying trading signals.
On Monday, there are no significant events or publications scheduled in the UK or the U.S. Therefore, we expect a "boring Monday," and the market will likely wait for the first release of important information to start trading more actively.
Explanation of the illustrations:
- Support and resistance levels (resistance/support): Thick red lines where price movement could end. They are not sources of trading signals.
- Kijun-sen and Senkou Span B lines: Lines from the Ichimoku indicator, transferred to the hourly time frame from the 4-hour chart. They are strong lines.
- Extremum levels: Thin red lines from which the price previously bounced. These are sources of trading signals.
- Yellow lines: Trend lines, trend channels, and other technical patterns.
- Indicator 1 on COT charts: Shows the size of the net position for each trader category.