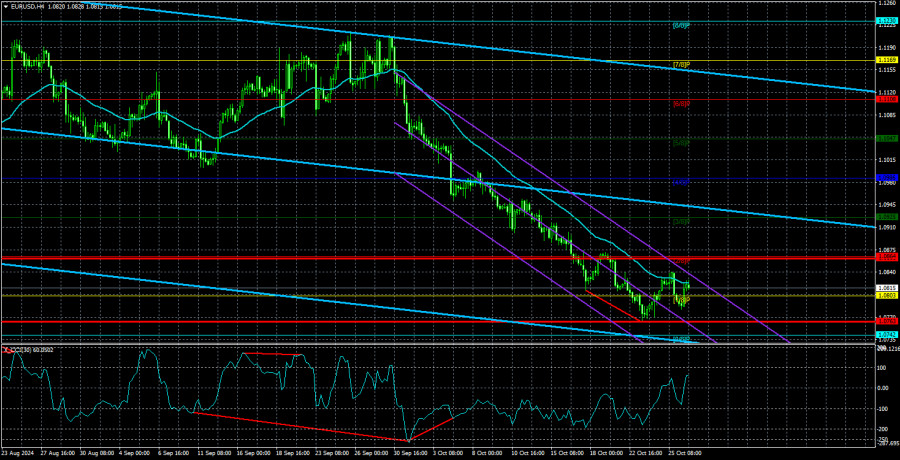
The EUR/USD currency pair showed no interesting movements on Monday, trading most of the day below the moving average line. While an upward correction still seems possible, it hasn't affected market sentiment. Therefore, even a consolidation above the moving average won't guarantee the start of a correction, especially since we've already seen such a break last week.
On Monday, no significant macroeconomic releases from the U.S. or the Eurozone left the market with little to react to. The euro did manage to gain slightly during morning trading, but a 35-pip upward movement hardly signifies much. The second trading day of the week will likely follow a similar pattern. The primary factor currently influencing market sentiment is the monetary policy stance of the European Central Bank and the Federal Reserve. While the Fed's policy easing has been fully or almost fully priced in, the ECB's easing is less so. The euro appreciated over the last two years despite the ECB lowering its already low rate more than the Fed. Therefore, we believe the euro's path is downward in the medium term. The global trend remains bearish, with a sideways trend on the weekly time frame. Since the price recently reversed near the channel's upper boundary, it could now fall toward the lower boundary at the 1.0435 level.
This week, the U.S. will release substantial information, and the Eurozone will also present some significant reports. Consequently, the market will likely wait to make major decisions until these reports are released. Only after data on the economy and inflation in the Eurozone and employment and unemployment figures in the U.S. will it become clearer what to expect from the ECB and the Fed at their upcoming meetings. We do not wish to speculate on these outcomes, as it's unlikely anyone can predict them in advance. Insider information may exist in the market but is not readily accessible to ordinary traders. Therefore, trading decisions will likely be made as the data is released. If most macroeconomic data favors the dollar, it could continue to rise. If most data is unfavorable for the dollar, a correction may start.
However, from our perspective, any such movement would be only an upward correction. Simply put, we expect the euro's decline to resume, whether strong or weak, once this correction is completed. Technically, a potential correction has been brewing for a couple of weeks, but it might remain limited.
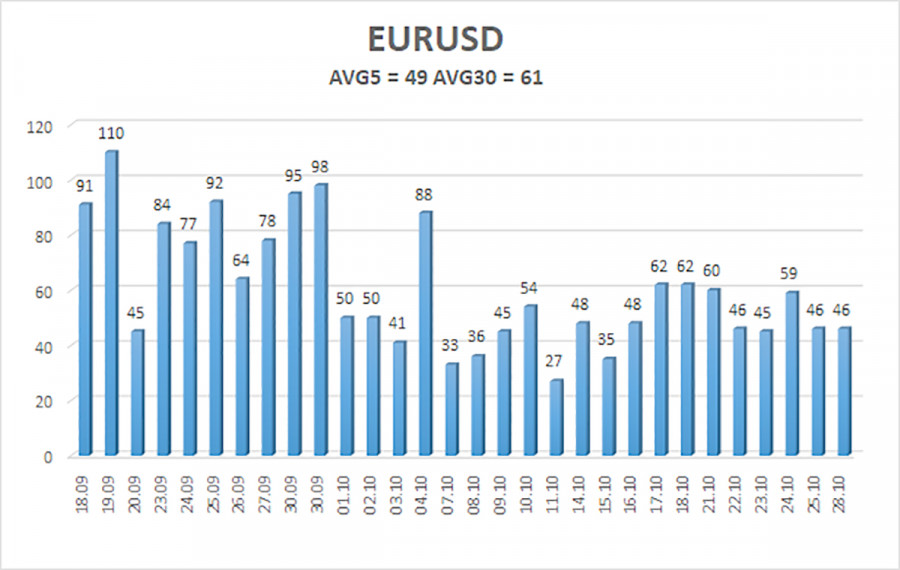
As of October 29, the average volatility for the EUR/USD pair over the past five trading days is 49 pips, classified as "low." We expect the pair to move between 1.0763 and 1.0861 on Tuesday. The higher linear regression channel points downward, indicating that the overall bearish trend persists. The CCI indicator has formed multiple bullish divergences, suggesting a correction may be on the way, but this is only a warning.
Nearest Support Levels:
- S1: 1.0803
- S2: 1.0742
- S3: 1.0681
Nearest Resistance Levels:
- R1: 1.0864
- R2: 1.0925
- R3: 1.0986
Trading Recommendations:
The EUR/USD pair continues its downward movement. In recent weeks, we have stated that we expect only a decline from the euro in the medium term, so we fully support the downward trend. There's a chance the market has priced in all or nearly all of the expected Fed rate cuts. If this is the case, the dollar has fewer reasons to fall, as it didn't have many reasons to decline previously. Short positions remain viable with targets at 1.0763 and 1.0742 if the price stays below the moving average. For traders using a purely technical approach, long positions are relevant only if the price consolidates above the moving average line, though this would likely signal only a correction.
Explanation of Illustrations:
Linear Regression Channels help determine the current trend. If both channels are aligned, it indicates a strong trend.
Moving Average Line (settings: 20,0, smoothed) defines the short-term trend and current trading direction.
Murray Levels act as target levels for movements and corrections.
Volatility Levels (red lines) represent the likely price range for the pair over the next 24 hours based on current volatility readings.
CCI Indicator: If it enters the oversold region (below -250) or overbought region (above +250), it signals an impending trend reversal in the opposite direction.


