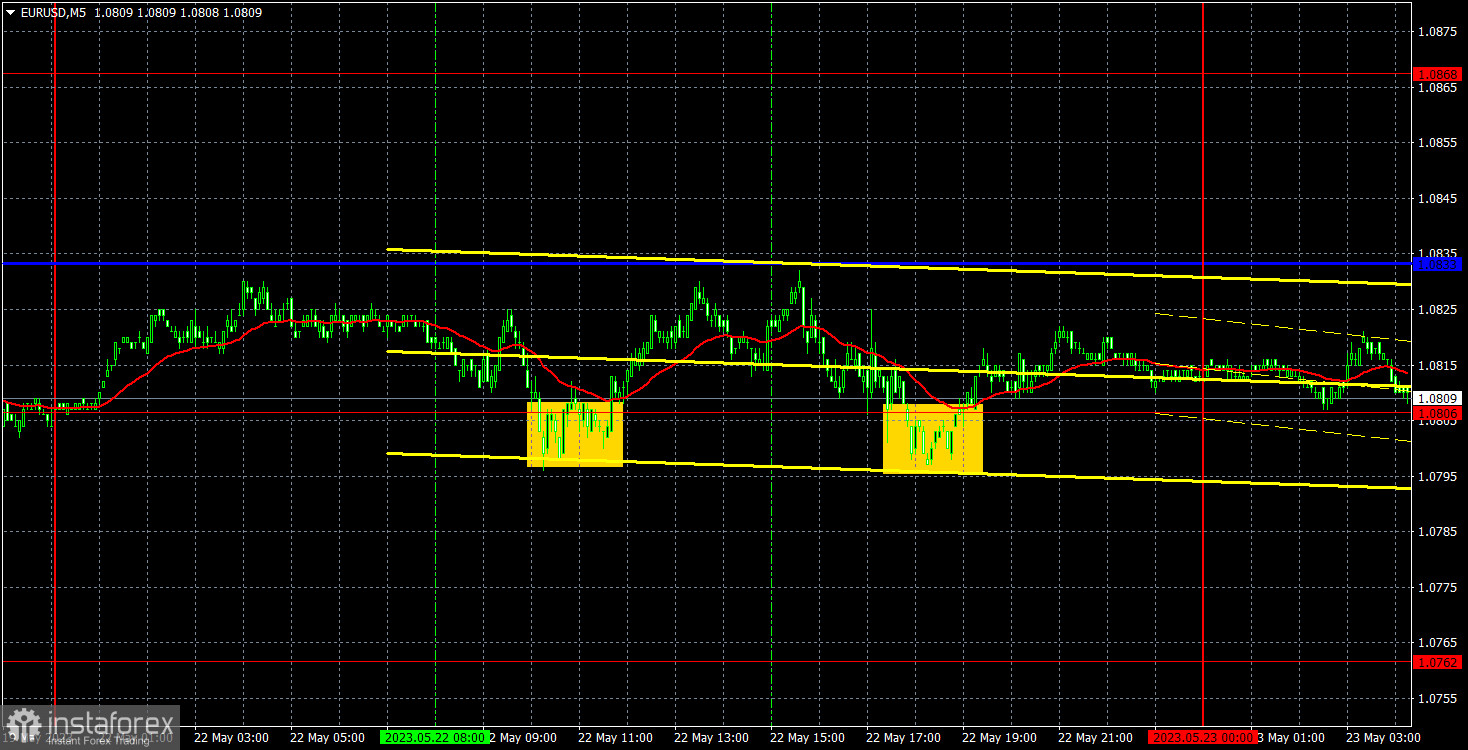
empty
23.05.2023 07:42 AM
EUR/USD: Forecast and trading signals on May 23, 2023. COT report. Detailed analysis of price movement and trades. Total flat, weak volatility

5M chart of EUR/USD

This image is no longer relevant

On Monday, EUR/USD traded in a tight range. It spent the entire day between the critical Kijun-sen line and the level of 1.0806, with volatility less than 40 pips. Naturally, under such conditions, it was extremely difficult to expect strong and profitable signals. However, I already warned you that Monday could be a boring day. In the chart above, it may seem that the pair settled below the level of 1.0806 twice, suggesting that two short positions should have been opened. However, that is not the case. Firstly, the 1.0806 level should have been considered in conjunction with the critical line. The potential stop-loss level would have been very high, as the stop-loss would have to be placed above the Kijun-sen. Moreover, volatility was very low. Secondly, each time the price settled below the level of 1.0806, it only amounted to at most 6 pips, which is very insignificant to declare a signal.

Therefore, it was better not to open any positions based on our recommendations. There was no significant macroeconomic news either in the United States or in the European Union. There were a few speeches by Federal Reserve representatives, but as evident from the market reaction, they did not mention anything important. James Bullard reiterated the need for interest rate hikes, but he does not have voting rights this year.
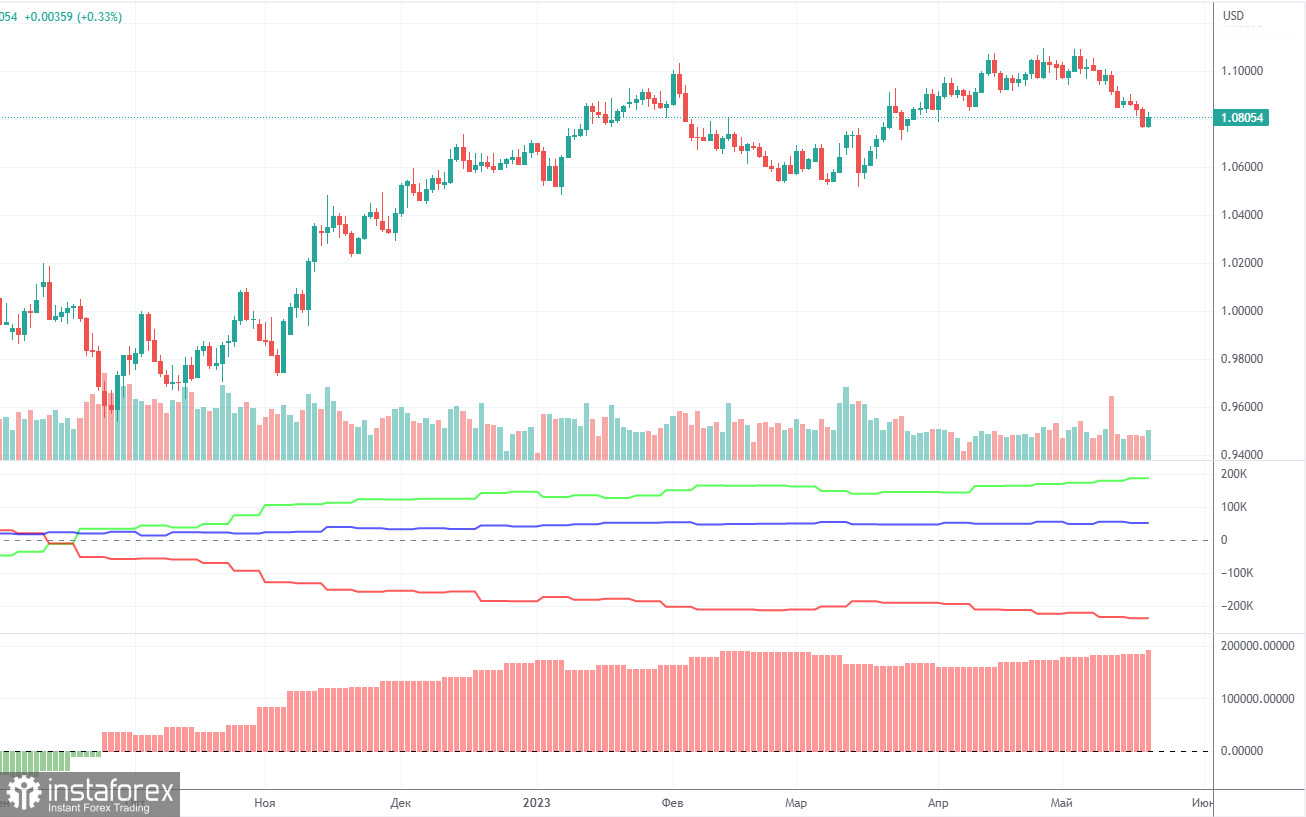
COT report:

This image is no longer relevant

The COT report for May 16 was delivered on Friday. Over the past 9 months, COT data has been in line with developments in the market. The net position (second indicator) has been on the rise since September 2022. The euro started to show strength approximately at the same time. Currently, the net non-commercial position is bullish and keeps growing further. Likewise, the euro is bullish.

Notably, we may assume by the extremely bullish net position that the uptrend may soon stop. The first indicator shows that, and the red and green lines are far away from each other, which is usually a sign that the end of the trend might be nearing. The euro attempted to go down several months ago, but those were just minor pullbacks. In the reporting week, long positions of non-commercial traders decreased by 1,600 and short positions dropped by 9,600. The net position rose by 8,000. The number of long positions exceeds that of short ones by 187,000, a rather big gap. A correction is still impending. So, it is clear that the pair may soon go down even without COT reports.
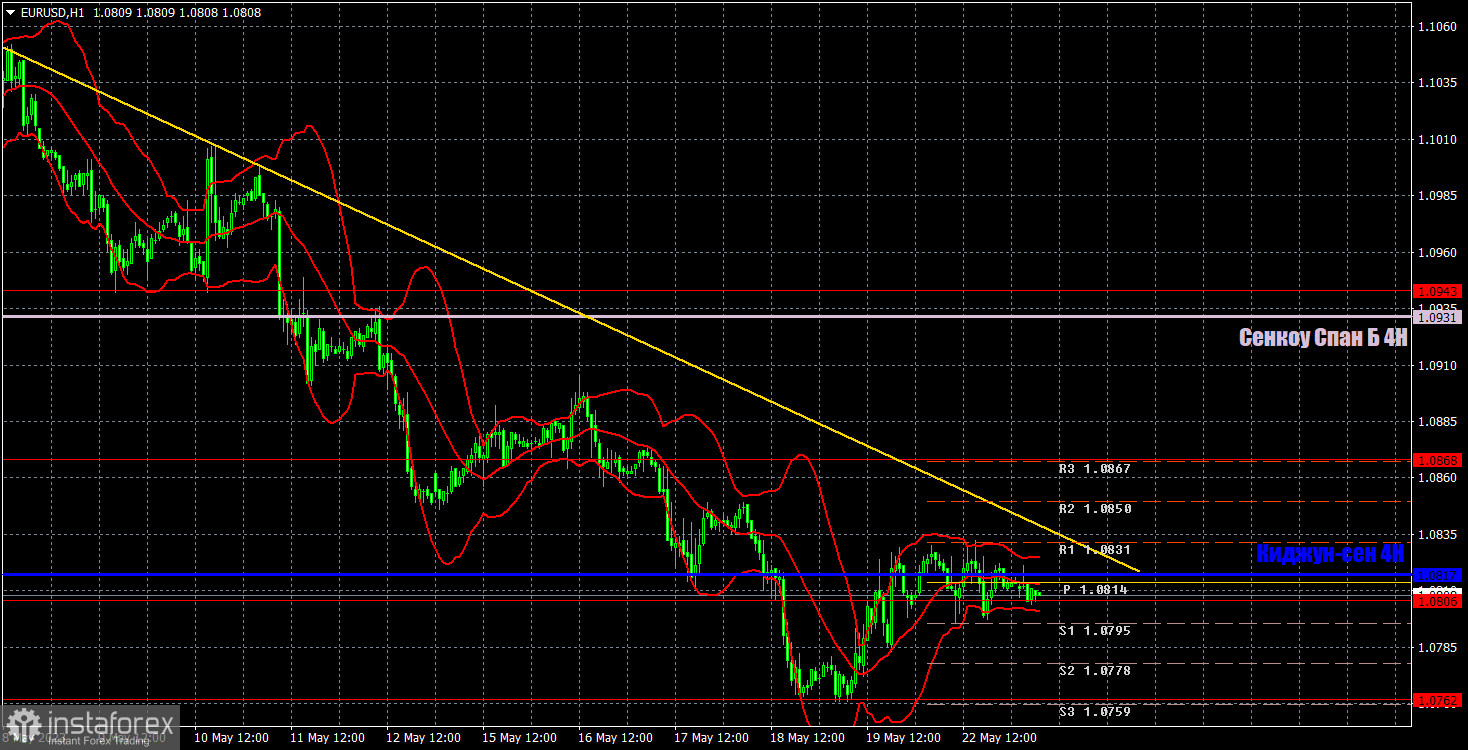
1H chart of EUR/USD

This image is no longer relevant

In the 1-hour time frame, the pair is moving down. The move is supported by the trendline. The greenback will likely keep strengthening against the euro because it is still oversold. All technical indicators signal a downtrend. Consolidation above the trendline and critical line may signal an uptrend. However, we still expect a fall in the medium term.

On May 23, trading levels are seen at 1.0581, 1.0658-1.0669, 1.0762, 1.0806, 1.0868, 1.0943, 1.1092, 1.1137-1.1185, as well as the Senkou Span B line (1.0931) and the Kijun-sen line (1.0817). Ichimoku indicator lines can move intraday, which should be taken into account when determining trading signals. There are also support and resistance although no signals are made near these levels. Signals could be made when the price either breaks or bounces from these extreme levels. Do not forget to place Stop Loss at the breakeven point when the price goes by 15 pips in the right direction. In case of a false breakout, it could save you from possible losses.

Today, the European Union, Germany, and the United States will publish PMIs for the services and manufacturing sectors. These are not that important, but as they are preliminary estimates, we can still expect some surprises. You should pay attention to the manufacturing sectors, as they remain below the 50 level in Europe. There are no other important events scheduled for Tuesday. In the US, Fed official Lorie Logan will speak. The market will unlikely react to that speech.

Indicators on charts:

Resistance/support - thick red lines, near which the trend may stop. They do not make trading signals.

Kijun-sen and Senkou Span B are the Ichimoku indicator lines moved to the hourly timeframe from the 4-hour timeframe. They are also strong lines.

Extreme levels are thin red lines, from which the price used to bounce earlier. They can produce trading signals.

Yellow lines are trend lines, trend channels, and other technical patterns.

Indicator 1 on the COT chart is the size of the net position of each trader category.

Indicator 2 on the COT chart is the size of the net position for the Non-commercial group of traders.

Paolo Greco,
Analytical expert of InstaForex
© 2007-2025
Select timeframe
5
min
15
min
30
min
1
hour
4
hours
1
day
1
week
Earn on cryptocurrency rate changes with InstaForex
Download MetaTrader 4 and open your first trade
  • Grand Choice
    Contest by
    InstaForex
    InstaForex always strives to help you
    fulfill your biggest dreams.
    JOIN CONTEST

Recommended Stories

Trading Recommendations and Analysis for GBP/USD on March 26: The Pound Continues to Swing

The GBP/USD currency pair showed growth again on Tuesday. "Again," because recently, all movements of the British currency resemble a "swing" or a "roller coaster" – first up, then down

Paolo Greco 02:40 2025-03-26 UTC+2

Trading Recommendations and Analysis for EUR/USD on March 26: The Euro Continues Its Sluggish Decline

The EUR/USD currency pair traded with only minimal gains on Tuesday, but the overall trend on the hourly timeframe remains bearish following the price's exit from the ascending channel

Paolo Greco 02:40 2025-03-26 UTC+2

GBP/USD: Trading Plan for the U.S. Session on March 25th (Review of Morning Trades)

In my morning forecast, I drew attention to the 1.2948 level and planned to make trading decisions from it. Let's look at the 5-minute chart and see what happened

Miroslaw Bawulski 18:15 2025-03-25 UTC+2

EUR/USD: Trading Plan for the U.S. Session on March 25th (Review of Morning Trades)

In my morning forecast, I highlighted the 1.0779 level and planned to make trading decisions based on it. Let's look at the 5-minute chart and examine what happened there

Miroslaw Bawulski 18:13 2025-03-25 UTC+2

How to Trade the EUR/USD Pair on March 25? Simple Tips and Trade Analysis for Beginners

Analysis of Monday's Trades 1H Chart of EUR/USD The EUR/USD currency pair continued its weak downward movement on Monday. The dollar failed to show any significant gains

Paolo Greco 06:29 2025-03-25 UTC+2

How to Trade the GBP/USD Pair on March 25? Simple Tips and Trade Analysis for Beginners

Analysis of Monday's Trades 1H Chart of GBP/USD The GBP/USD pair traded both up and down on Monday. The uptrend remains intact thanks to the ascending trendline, which has been

Paolo Greco 06:29 2025-03-25 UTC+2

Trading Recommendations and Analysis for GBP/USD on March 25: The Roller Coaster Continues

The GBP/USD currency pair managed to move both upward and downward on Monday. We can't say that these movements were triggered by macroeconomic data, because they weren't. The UK's business

Paolo Greco 02:41 2025-03-25 UTC+2

Trading Recommendations and Analysis for EUR/USD on March 25: The Dollar Strengthened Against the Odds

On Monday, the EUR/USD currency pair initially showed an upward move, followed by a decline, making the entire trading day somewhat contradictory. Volatility remained low despite the release

Paolo Greco 02:41 2025-03-25 UTC+2

GBP/USD: Trading Plan for the U.S. Session on March 24th (Review of Morning Trades)

In my morning forecast, I highlighted the level of 1.2968 and planned to make trading decisions based on it. Let's look at the 5-minute chart and analyze what happened

Miroslaw Bawulski 16:05 2025-03-24 UTC+2

EUR/USD: Trading Plan for the U.S. Session on March 24th (Review of Morning Trades)

In my morning forecast, I highlighted the level of 1.0856 and planned to make trading decisions based on it. Let's take a look at the 5-minute chart and see what

Miroslaw Bawulski 16:01 2025-03-24 UTC+2
Can't speak right now?
Ask your question in the chat.
Widget callback
 

Dear visitor,

Your IP address shows that you are currently located in the USA. If you are a resident of the United States, you are prohibited from using the services of InstaFintech Group including online trading, online transfers, deposit/withdrawal of funds, etc.

If you think you are seeing this message by mistake and your location is not the US, kindly proceed to the website. Otherwise, you must leave the website in order to comply with government restrictions.

Why does your IP address show your location as the USA?

  • - you are using a VPN provided by a hosting company based in the United States;
  • - your IP does not have proper WHOIS records;
  • - an error occurred in the WHOIS geolocation database.

Please confirm whether you are a US resident or not by clicking the relevant button below. If you choose the wrong option, being a US resident, you will not be able to open an account with InstaForex anyway.

We are sorry for any inconvenience caused by this message.