empty
03.05.2022 04:40 PM
Trading Signal for Gold (XAU/USD) for May 03-04, 2022: buy above $1,858 (200 EMA - uptrend channel)

This image is no longer relevant

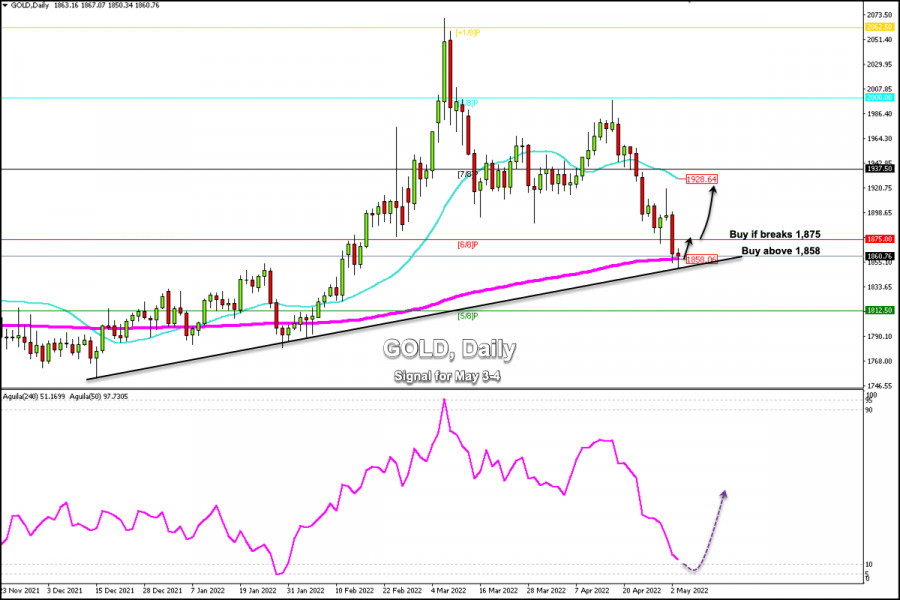
In the European trade, Gold (XAU/USD) reached a new low of 1,850, the price level of February 15. Gold is currently trading at 1,860, above the 200 EMA and below the 21 SMA.

According to the daily chart, we can see that gold has touched the uptrend channel formed on December 15, 2021. As long as the metal keeps trading above 1,850, it is likely to recover part of its losses and could reach the level of 1,930 in the next few days.

On the other hand, a daily close below 1,850 will be the start of a medium-term downtrend and we could expect a continuation of the bearish move. Gold could reach 5/8 Murray at 1,812.50.

10-year Treasury bond yields reached the highest level since December 2018 at 3.00%. It puts downward pressure on gold. However, in the American session, it is retreating, which relieves the downward pressure on gold.

Yields remain high as investors trust the aggressive stance of the Fed. All traders, the stock and currency markets are waiting for the US central bank to raise interest rates by 0.50% to 1% so far. This data will be published tomorrow in the afternoon of the American session.

Our trading plan is to buy above the 200 EMA around 1,858 with targets at 1,875. A sharp break and close above 1,875 on the daily chart will be a good signal to buy with targets at 1,900 and 1,928.

The eagle indicator on the daily chart is reaching the zone 10-point which represents a strongly oversold level. If gold manages to trade above 1,875, it could be a key sign that the price could extend its bounce in the coming days and reach 1,900.

Dimitrios Zappas,
InstaForex के विश्लेषणात्मक विशेषज्ञ
© 2007-2025
समय सीमा चुनें
5
मिनट
15
मिनट
30
मिनट
1
घंटा
4
घंटे
1
दिन
1
सप्ताह
Earn on cryptocurrency rate changes with InstaForex
Download MetaTrader 4 and open your first trade
  • Grand Choice
    Contest by
    InstaForex
    InstaForex always strives to help you
    fulfill your biggest dreams.
    कॉन्टेस्ट में हिस्सा लें

अनुशंसित लेख

USD/JPY का पूर्वानुमान — 15 मई, 2025

कल के ट्रेडिंग सत्र के अंत तक, USD/JPY जोड़ी 73 पिप्स गिर गई और नीचे की छाया के साथ MACD संकेतक लाइन का परीक्षण किया। यह स्पष्ट है कि 145.08–145.91

Laurie Bailey 06:53 2025-05-15 UTC+2

ऑस्ट्रेलियाई डॉलर/जापानी येन क्रॉस करेंसी जोड़ी की इंट्राडे मूल्य आंदोलन का तकनीकी विश्लेषण, बुधवार, 14 मई, 2025।

हालाँकि 4 घंटे के चार्ट पर ऑस्ट्रेलियाई डॉलर/जापानी येन क्रॉस करेंसी जोड़ी अभी भी WMA (30 शिफ्ट 2) के ऊपर बनी हुई है, जिसका ढलान ऊपर की ओर है, लेकिन

Arief Makmur 11:33 2025-05-14 UTC+2

14 मई, 2025 को EUR/USD का विश्लेषण

मंगलवार को, EUR/USD जोड़ी 1.1074–1.1081 के समर्थन क्षेत्र से पलटकर यूरो के पक्ष में पलट गई, और 110 अंक बढ़ी। इस प्रकार, भालुओं की खुशी बहुत समय तक नहीं रही।

Samir Klishi 11:22 2025-05-14 UTC+2

प्राकृतिक तेल वस्तु उपकरण की दैनिक मूल्य आंदोलन का तकनीकी विश्लेषण, बुधवार, 14 मई, 2025।

जैसा कि क्रूड ऑयल वस्तु उपकरण के 4 घंटे के चार्ट पर देखा गया है, कुछ दिलचस्प तथ्य हैं। पहले, डबल बॉटम पैटर्न का उभार, इसके बाद #CL मूल्य आंदोलन

Arief Makmur 11:18 2025-05-14 UTC+2

EUR/USD का पूर्वानुमान 13 मई, 2025 के लिए

कल का मुख्य घटनाक्रम, जिसने बाजारों को कुछ हद तक उलझा दिया, वह था यू.एस. और चीन के बीच 2 अप्रैल से पहले जो पारस्परिक शुल्क थे, उन्हें फिर से

Laurie Bailey 06:42 2025-05-13 UTC+2

GBP/USD का पूर्वानुमान 13 मई, 2025 के लिए

कल के अंत तक, ब्रिटिश पाउंड 129 पिप्स गिरा, जो डॉलर इंडेक्स में 1.43% की वृद्धि के बाद हुआ। 1.3184–1.3208 के समर्थन क्षेत्र को तोड़ा गया, और गति दैनिक बैलेंस

Laurie Bailey 06:39 2025-05-13 UTC+2

13 मई, 2025 के लिए USD/JPY का पूर्वानुमान

USD/JPY जोड़ी ने कल एक तेज और मजबूत हलचल की, जिसमें तीन से अधिक अंक कवर किए और सटीक रूप से 148.66 के लक्ष्य स्तर तक पहुंची, जो पिछले दिसंबर

Laurie Bailey 06:36 2025-05-13 UTC+2

नैस्डैक 100 इंडेक्स की इंट्राडे प्राइस मूवमेंट का तकनीकी विश्लेषण – गुरुवार, 08 मई 2025।

नैस्डैक 100 इंडेक्स की प्राइस मूवमेंट और स्टोकेस्टिक ऑस्सीलेटर इंडिकेटर के बीच डाइवर्जेंस के साथ-साथ इसकी प्राइस मूवमेंट SMA (50) से ऊपर बनी हुई है, जो कि ऊपर की

Arief Makmur 11:26 2025-05-08 UTC+2

मंगलवार, 6 मई 2025 को क्रूड ऑयल कमोडिटी इंस्ट्रूमेंट की इंट्राडे मूल्य गति का तकनीकी विश्लेषण।

मूल्य गति उच्च निम्न - निम्न निम्न बना रही है और WMA (30 Shift 2) की गिरती ढलान और क्रूड ऑयल कीमतों की इसके नीचे जाती हुई गति द्वारा समर्थित

Arief Makmur 13:35 2025-05-06 UTC+2

मंगलवार, 6 मई 2025 को GBP/AUD क्रॉस करेंसी पेयर की इंट्राडे मूल्य गति का तकनीकी विश्लेषण।

4-घंटे के चार्ट पर, GBP/AUD क्रॉस करेंसी पेयर अभी भी विक्रेताओं द्वारा हावी दिखाई दे रहा है, जिसे इसके मूल्य आंदोलन से पुष्टि होती है, जो WMA (30 Shift 2)

Arief Makmur 13:33 2025-05-06 UTC+2
अभी बात नहीं कर सकते?
अपना प्रश्न पूछें बातचीत.
Widget callback
 

Dear visitor,

Your IP address shows that you are currently located in the USA. If you are a resident of the United States, you are prohibited from using the services of InstaFintech Group including online trading, online transfers, deposit/withdrawal of funds, etc.

If you think you are seeing this message by mistake and your location is not the US, kindly proceed to the website. Otherwise, you must leave the website in order to comply with government restrictions.

Why does your IP address show your location as the USA?

  • - you are using a VPN provided by a hosting company based in the United States;
  • - your IP does not have proper WHOIS records;
  • - an error occurred in the WHOIS geolocation database.

Please confirm whether you are a US resident or not by clicking the relevant button below. If you choose the wrong option, being a US resident, you will not be able to open an account with InstaForex anyway.

We are sorry for any inconvenience caused by this message.