EUR/USD 5M

The EUR/USD pair continued to trade indistinctly on the first trading day of the week. On the higher TF, it is clearly visible that a flat has formed for the pair in the last few days. On the one hand, this is logical, since there were no important news and events in terms of macroeconomics in the world. On the other hand, we continue to believe that the market is under great strain, since it is unclear what the Ukrainian-Russian conflict will turn out to be and who may be drawn into it over time. Now is the time when any military conflict can turn into a world war. Moreover, we all understand perfectly well that this is not a Ukraine-Russia conflict, this is a West-Russia conflict. Thus, we believe that at this time the foreign exchange market is frozen in anticipation. Waiting for the denouement. And the denouement is still moving in the direction of a new escalation. On Monday, as already mentioned, there were no macroeconomic events either in the United States or in the EU. However, the movements during the day were quite active. Let's look at the trading signals.
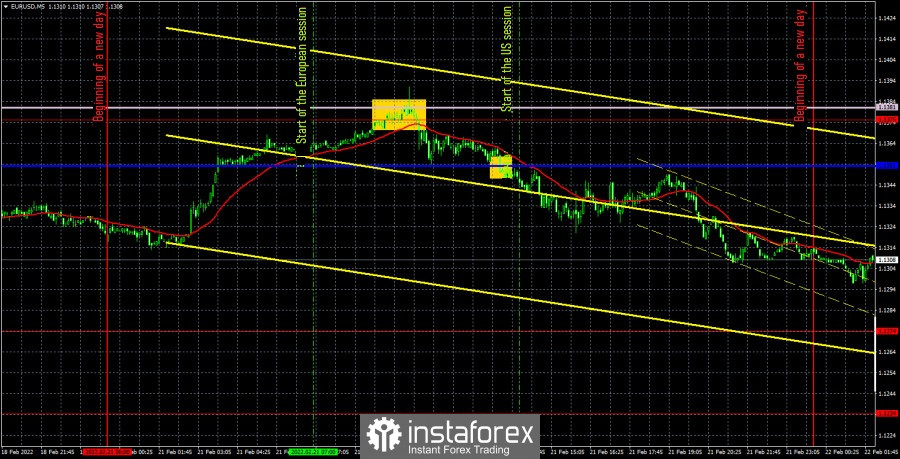
The first sell signal was formed during the price rebound from the Senkou Span B line and the 1.1375 level. Subsequently, the price went down about 45 points, overcoming the critical Kijun-sen line along the way and thus forming a second sell signal. In principle, both sell signals turned out to be profitable, so traders in any case made profits on either of them. Of course, it was necessary to open short positions at the first sell signal, and not at the second.
COT report

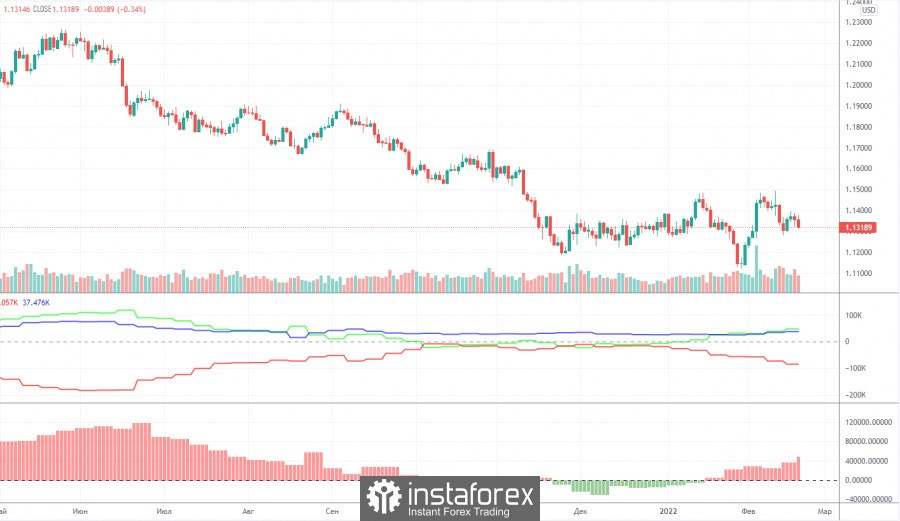
The new Commitment of Traders (COT) report, which was released on Friday, showed a new strengthening of the bullish mood among professional traders. This time, the "non-commercial" group closed about 7,000 contracts for short positions on the euro and opened 5,000 contracts for long positions. Thus, the net position increased by 12,000, which is clearly visible on the second indicator in the chart above. The total number of long positions exceeds the number of short positions by 50,000, so now we can really say that a new upward trend is beginning to form. It would be possible to say, if not for one "but". The European currency is not growing. It does not grow even at a time when there seem to be technical grounds for this. And they are quite simple: the pair has been falling for 14 months, so a correction is a fairly likely scenario. However, the fundamental background does not allow the euro to grow, so it is located very close to its annual lows. Actually, only 100 points away from them. Moreover, after the quotes fell to the level of 1.1180 at the end of November, traders failed to adjust the currency pair normally. The highest deviation from the lows was 360 points. Thus, we would say that now the data of COT reports do not coincide with the fundamental background and the technical picture that we see on a daily basis. And this is very strange, given the small influence of central banks on the money supply at this time.
We recommend to familiarize yourself with:
Overview of the EUR/USD pair. February 22. What solutions in theory can be expected from Joe Biden and Vladimir Putin?
Overview of the GBP/USD pair. February 22. Boris Johnson is ready to impose even more serious sanctions against Moscow than originally planned.
Forecast and trading signals for GBP/USD on February 22. Detailed analysis of the movement of the pair and trading transactions.
EUR/USD 1H

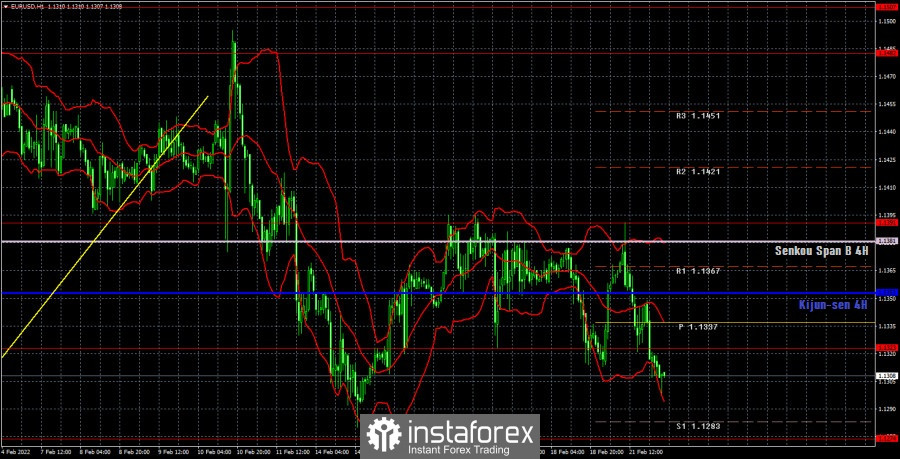
The indistinctness of the current movements is even better visible on the hourly timeframe. If a couple of weeks ago the pair at least tried to show a trend movement, now it is firmly stuck between the levels of 1.1323 and 1.1391, which is clearly seen in the chart above. Thus, we now need to wait for the price to leave the horizontal channel. It is possible to trade on the lines of the Ichimoku indicator, but we remind you that they are not strong in the flat. On Tuesday, we allocate the following levels for trading – 1.1192, 1.1234, 1.1274, 1.1323, 1.1391, 1.1482, as well as the Senkou Span B (1.1381) and Kijun-sen (1.1353) lines. There are also support and resistance levels, but no signals will be formed near them. The lines of the Ichimoku indicator may change their position during the day, which should be taken into account when searching for trading signals. Signals can be "bounces" and "breakthrough" levels - extremes and lines. Do not forget about placing a Stop Loss order at breakeven if the price went in the right direction of 15 points. This will protect you against possible losses if the signal turns out to be false. On February 22, no important events and publications are planned in the European Union, but there will be several medium-sized reports in the United States. Business activity indices are theoretically capable of influencing the market, but we believe that this will not happen in the current circumstances.
Explanations for the chart:
Support and Resistance Levels are the levels that serve as targets when buying or selling the pair. You can place Take Profit near these levels.
Kijun-sen and Senkou Span B lines are lines of the Ichimoku indicator transferred to the hourly timeframe from the 4-hour one.
Support and resistance areas are areas from which the price has repeatedly rebounded off.
Yellow lines are trend lines, trend channels and any other technical patterns.
Indicator 1 on the COT charts is the size of the net position of each category of traders.
Indicator 2 on the COT charts is the size of the net position for the non-commercial group.


