empty
 
 
01.03.2022 11:29 AM
Trading plan for starters of EUR/USD and GBP/USD on March 1, 2022

Details of the economic calendar from February 28:

Monday was traditionally accompanied by a blank macroeconomic calendar. Nevertheless, the massive information and news flow will continue to play on the nerves of speculators.

Analysis of trading charts from February 28

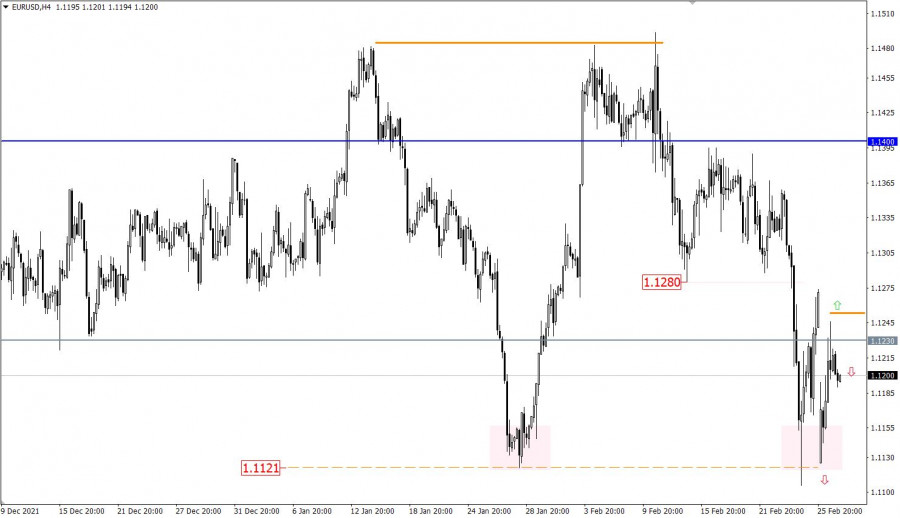
The EURUSD currency pair opened a new trading week with a gap of 150 points, where the price gap was practically closed during the day. This led to the return of the price to the resistance level of 1.1230, where there was a reduction in the volume of long positions.

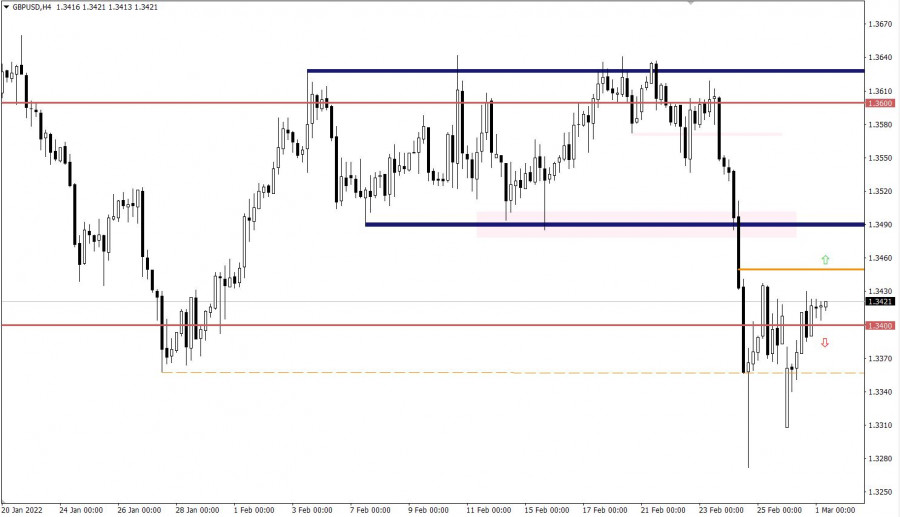
During the price pullback, the GBPUSD currency pair returned the quote to the area of the local maximum on February 25 - 1.3437, where there were reductions in the volume of long positions and stagnation.

This image is no longer relevant

March 1 economic calendar:

Today, data on business activity in the manufacturing sector of Europe, Britain and the USA will be published, I deeply doubt that these figures will be of interest to anyone in the market. That's right, traders will continue to work based on the information and news flow, since it is currently considered the only engine for the entire market.

Trading plan for EUR/USD on March 1:

In this situation, we can assume that the absence of holding the price above the resistance level of 1.1230 will lead to a gradual weakening of the euro. In this case, the quote may again fall to the support point of 1.1121. An alternative scenario will be considered by traders if the price holds above 1.1250 in a four-hour period. This move may support the euro locally in the direction of 1.1280 - 1.1300.

This image is no longer relevant

Trading plan for GBP/USD on March 1:

In this situation, the price rebound from the level of 1.3437 may lead to a reverse move towards 1.3357 - 1.3300. This move will indicate the subsequent stage of recovery of dollar positions in the market. The alternative scenario will be relevant if the price holds above 1.3450 in a four-hour period. In this case, a local return of the price to the values of 1.3480-1.3500 is possible.

This image is no longer relevant

What is reflected in the trading charts?

A candlestick chart view is graphical rectangles of white and black light, with sticks on top and bottom. When analyzing each candle in detail, you will see its characteristics of a relative period: the opening price, closing price, and maximum and minimum prices.

Horizontal levels are price coordinates, relative to which a stop or a price reversal may occur. These levels are called support and resistance in the market.

Circles and rectangles are highlighted examples where the price of the story unfolded. This color selection indicates horizontal lines that may put pressure on the quote in the future.

The up/down arrows are the reference points of the possible price direction in the future.

Gven Podolsky,
InstaForex के विश्लेषणात्मक विशेषज्ञ
© 2007-2024
Earn on cryptocurrency rate changes with InstaForex
Download MetaTrader 4 and open your first trade
  • Grand Choice
    Contest by
    InstaForex
    InstaForex always strives to help you
    fulfill your biggest dreams.
    कॉन्टेस्ट में हिस्सा लें
  • चैन्सी डिपॉजिट
    $ 3,000 के साथ अपना खाता जमा करें और प्राप्त करें $5000 अधिक!
    में नवंबर हम आकर्षित करते हैं $5000 चैंसी डिपॉज़िट में
    ट्रेडिंग अकाउंट में $ 3,000 जमा करके जीतने का अवसर प्राप्त करें इस शर्त को पूरा करके आप प्रतियोगिता में भाग ले सकते हैं
    कॉन्टेस्ट में हिस्सा लें
  • ट्रेड वाइज़, विन डिवाइस
    कम से कम $500 के साथ अपने खाते में टॉप अप करें, कॉन्टेस्ट के लिए साइन अप करें और मोबाइल डिवाइस जीतने का मौका पाएं।
    कॉन्टेस्ट में हिस्सा लें
  • 100% बोनस
    अपनी जमा राशि पर 100% बोनस प्राप्त करने का आपका अनूठा अवसर
    बोनस पायें
  • 55% बोनस
    अपनी प्रत्येक डिपॉजिट पर 55% बोनस के लिए आवेदन करें
    बोनस पायें
  • 30% बोनस
    हर बार खाता टॉप अप करने पर 30% बोनस प्राप्त करें
    बोनस पायें

अनुशंसित लेख

अभी बात नहीं कर सकते?
अपना प्रश्न पूछें बातचीत.
Widget callback