Analysis of Tuesday's deals:
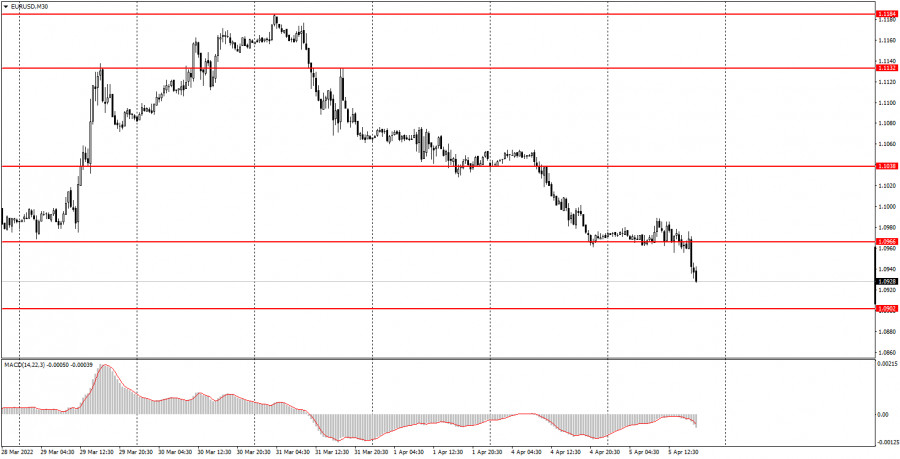
30M chart of the EUR/USD pair.

The EUR/USD currency pair traded badly for most of the day on Tuesday. Throughout the Asian and European sessions, the pair moved exclusively sideways with minimal volatility. The morning business activity indices in the European Union did not affect the pair's movement. Nevertheless, the European currency resumed its decline in the afternoon, which was unlikely to be associated with the publication of macroeconomic reports in the United States. Because there was only one report worth paying attention to today - the ISM business activity index in the service sector. At the end of March, it increased by 1.8 points and amounted to 58.3. Not too much difference from February. Therefore, we believe that it was not the reason for the new strengthening of the US currency. But the introduction of a new package of sanctions against Russia by the European Union, including a ban on entering European ports for Russian ships, disconnecting several more banks from SWIFT, and banning the import of Russian coal, could well provoke a new fall in the euro, as these sanctions will also hit the European economy. Relations between the Russian Federation and the EU continue to deteriorate, and the geopolitical conflict in Ukraine remains in a state of hostilities. All this does not contribute to the growth of the euro.
5M chart of the EUR/USD pair.
On the 5-minute timeframe, the movement on Tuesday was very eloquent. For two-thirds of the day, the pair traded between the levels of 1.0966 and 1.0989. That is, in a very narrow side channel. At the same time, a lot of trading signals were formed, which, by and large, can be considered false. Only the first and second signals led to the development of the nearest target level, which was located 20 points away. All other signals did not even provoke such a movement and were extremely inaccurate and ambiguous. Nevertheless, the first signal from the level of 1.0966 and the second signal from the level of 1.0989 could be tried to work out, since at that time it was still not obvious that the pair was flat. However, there is also one problem. The level of 1.0989 is the maximum of today, so it did not participate in the auction. Therefore, we have the following picture - all the trading signals of the day were formed around the level of 1.0966 and none led to the working out of the nearest target. At the first two buy signals, the price went up 15 points, which was enough to place a Stop Loss order at breakeven. It was on this order that both deals were eventually closed. All subsequent signals should not have been worked out. Only the most recent signal near the level of 1.0945 could be worked out by a short position, and it could bring about 10-15 points of profit.
How to trade on Wednesday:
A new downward trend has been formed in the 30-minute timeframe, but it is impossible to form a channel or a trend line now since at least two reference points are missing. Thus, there is a downward trend, but there is no trend line. Nevertheless, the European currency may continue to fall, at least to its local lows, which are now near the levels of 1.0902 and 1.0806. On the 5-minute TF tomorrow, it is recommended to trade by levels 1.0806, 1.0902, 1.0945, 1.0966, 1.0989, and 1.1038. When passing 15 points in the right direction, you should set the Stop Loss to breakeven. There will be no important events or reports in the European Union on Wednesday. In the USA - late in the evening the publication of the minutes of the Fed's last meeting. In any case, it will not affect novice traders, since by that time they will have to leave the market.
Basic rules of the trading system:
1) The signal strength is calculated by the time it took to generate the signal (rebound or overcoming the level). The less time it took, the stronger the signal.
2) If two or more trades were opened near a certain level on false signals, then all subsequent signals from this level should be ignored.
3) In a flat, any pair can form a lot of false signals or not form them at all. But in any case, at the first signs of a flat, it is better to stop trading.
4) Trade transactions are opened in the period between the beginning of the European session and the middle of the American session when all transactions must be closed manually.
5) On a 30-minute TF, signals from the MACD indicator can be traded only if there is good volatility and a trend, which is confirmed by a trend line or a trend channel.
6) If two levels are located too close to each other (from 5 to 15 points), then they should be considered as a support or resistance area.
What's on the charts:
Price support and resistance levels - the levels that are the targets when opening purchases or sales. Take Profit levels can be placed near them.
Red lines - channels or trend lines that display the current trend and show in which direction it is preferable to trade now.
MACD indicator (14,22,3) is a histogram and a signal line - an auxiliary indicator that can also be used as a signal source.
Important speeches and reports (always contained in the news calendar) can greatly influence the movement of a currency pair. Therefore, during their exit, it is recommended to trade as carefully as possible or exit the market to avoid a sharp price reversal against the previous movement.
Forex beginners should remember that every trade cannot be profitable. The development of a clear strategy and money management are the keys to success in trading over a long period.


