empty
01.07.2022 03:50 PM
AUD/USD Technical Analysis and Trading Tips for July 1, 2022

This image is no longer relevant

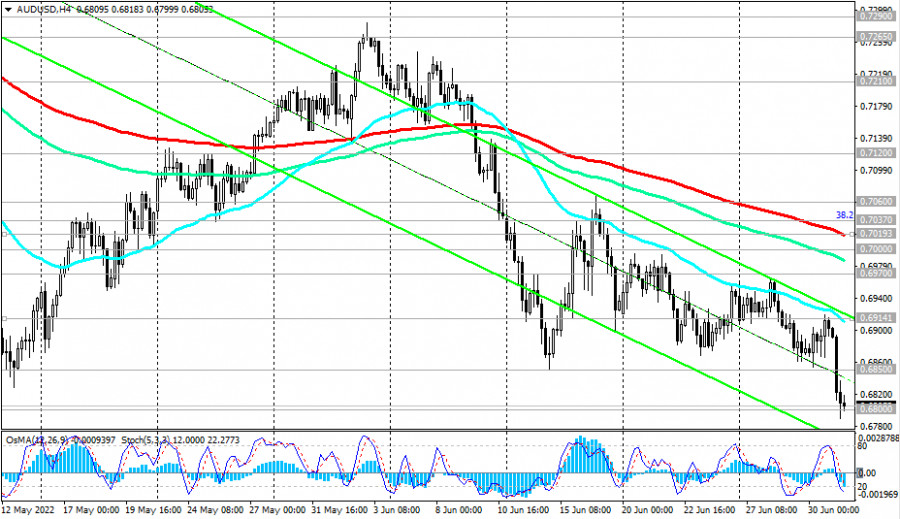
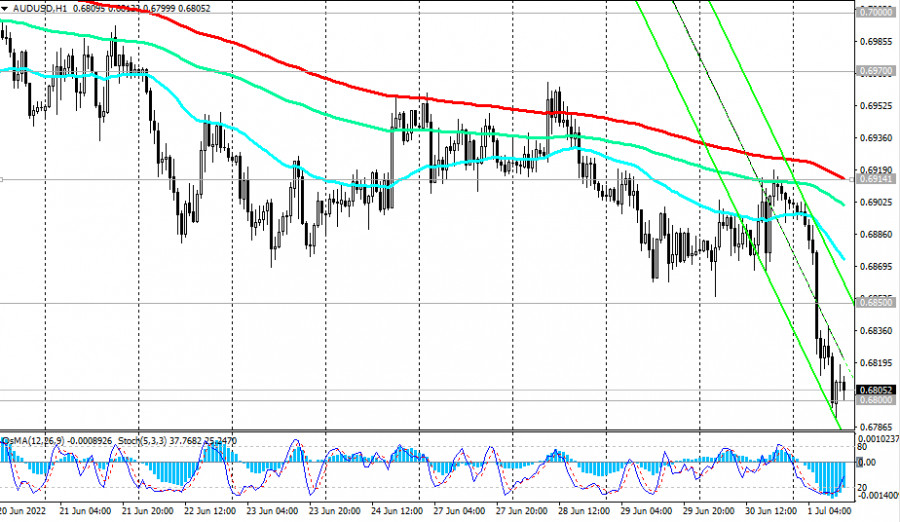
At the beginning of today's European trading session, AUD/USD reached a new local and 25-month low of 0.6790.

The main driver of the decline in AUD/USD is the Fed's monetary policy, the most stringent (at the moment) in comparison with other major world central banks.

This image is no longer relevant

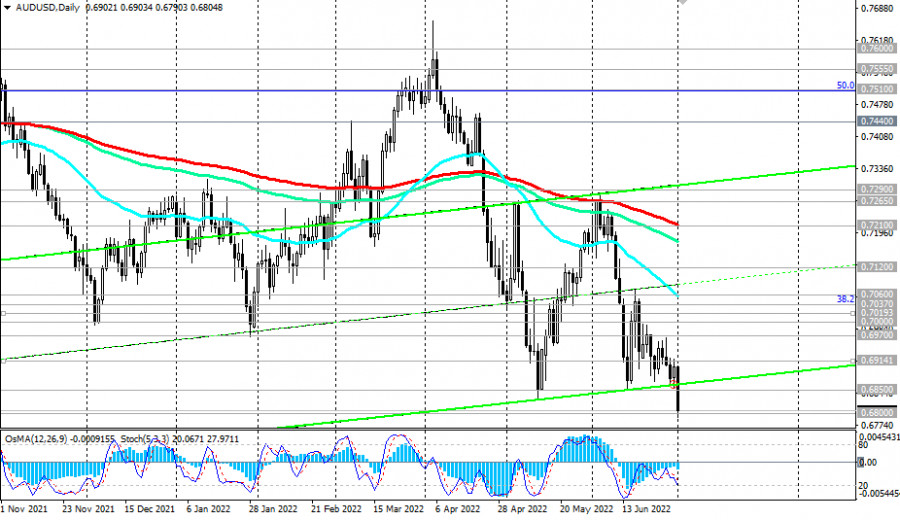
AUD/USD continues to decline towards the lower border of the descending channel on the daily chart, which is currently passing near the 0.6700 mark.

In view of the Fed's tendency to pursue a tighter monetary policy, in anticipation of further strengthening of the US dollar and given the average daily volatility of AUD/USD 60-70 points, most likely, the target of 0.6700 can be reached within the next 1-2 trading days, especially if the RBA disappoints the markets at its July 5 meeting.

This image is no longer relevant

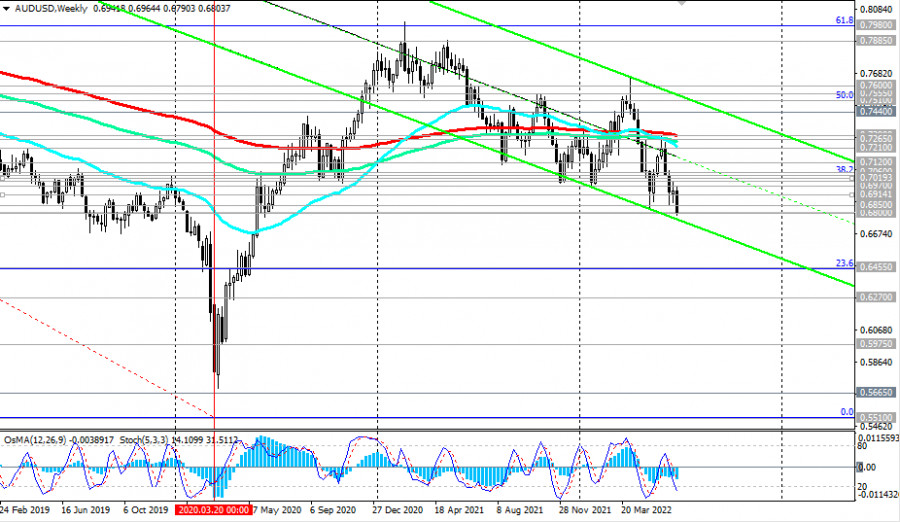
As we noted in our previous review dated 06/21/2022, a breakdown of local support levels 0.6850, and 0.6800 will confirm our assumption, and AUD/USD will head towards multi-year lows reached in March 2020 near 0.5665, 0.5510 with intermediate targets at support levels 0.6500, 0.6455 (23.6% Fibonacci retracement to the pair's decline from 0.9500 in July 2014 to 2020 lows near 0.5510), 0.6270, 0.5975.

The continued positive upward trend in US 10-year bond yields makes the dollar an attractive asset to invest in, given the prospects for further tightening of the Fed's monetary policy. The dollar is also actively used as a defensive asset, winning over traditional defensive assets such as gold, franc, and yen.

This image is no longer relevant

In an alternative scenario, AUD/USD will attempt a correction from the reached support level of 0.6800. In this case, the first signal to open long, for short-term positions, will be a breakdown of the local resistance level of 0.6850, and a confirming one is at a breakdown of the short-term resistance level of 0.6914 (200 EMA on the 4-hour chart). In this case, the upward correction may continue up to the resistance levels of 0.7000, 0.7019 (200 EMA on the 4-hour chart). Below the key resistance levels 0.7210 (200 EMA on the daily chart), 0.7290 (200 EMA on the weekly chart, 50 EMA on the monthly chart), AUD/USD remains in the zone of a long-term bearish market. Only a breakdown of the resistance level of 0.7600 (200 EMA on the monthly chart) will bring AUD/USD into the zone of a long-term bull market.

Support levels: 0.6800, 0.6700, 0.6500, 0.6455, 0.6270, 0.5975, 0.5665, 0.5510

Resistance levels: 0.6850, 0.6900, 0.6914, 0.6970, 0.7000, 0.7019, 0.7037, 0.7060, 0.7120, 0.7210, 0.7265, 0.7290

Trading Tips

Sell Stop 0.6780. Stop-Loss 0.6860. Take-Profit 0.6700, 0.6500, 0.6455, 0.6270, 0.5975, 0.5665, 0.5510

Buy Stop 0.6860. Stop-Loss 0.6780. Take-Profit 0.6900, 0.6914, 0.6970, 0.7000, 0.7019, 0.7037, 0.7060, 0.7120, 0.7210, 0.7265, 0.7290

Jurij Tolin,
InstaForex के विश्लेषणात्मक विशेषज्ञ
© 2007-2025
समय सीमा चुनें
5
मिनट
15
मिनट
30
मिनट
1
घंटा
4
घंटे
1
दिन
1
सप्ताह
Earn on cryptocurrency rate changes with InstaForex
Download MetaTrader 4 and open your first trade
  • Grand Choice
    Contest by
    InstaForex
    InstaForex always strives to help you
    fulfill your biggest dreams.
    कॉन्टेस्ट में हिस्सा लें

अनुशंसित लेख

7 मई के लिए GBP/USD ट्रेडिंग सिफारिशें और विश्लेषण: पाउंड समय बर्बाद नहीं कर रहा है

मंगलवार को, GBP/USD मुद्रा जोड़ी अचानक और अप्रत्याशित रूप से ऊपर की ओर बढ़ने लगी। जबकि यूरो एक सपाट बाजार में फंसा हुआ था, ब्रिटिश पाउंड ने मजबूत रैली दिखाई

Paolo Greco 06:48 2025-05-07 UTC+2

GBP/USD पर ट्रेडिंग सिफारिशें और विश्लेषण – 5 मई: डॉलर की झटकेदार चालें जारी हैं

शुक्रवार को GBP/USD करेंसी पेयर ने सोमवार की बढ़त और व्यापक अपट्रेंड के खिलाफ एक करेक्शन दिखाया। हफ्ते के किसी भी दिन—सोमवार से शुक्रवार तक—इन मूवमेंट्स के कोई स्पष्ट कारण

Paolo Greco 11:18 2025-05-05 UTC+2

5 मई को EUR/USD जोड़ी में कैसे ट्रेड करें? शुरुआती लोगों के लिए सरल टिप्स और ट्रेड विश्लेषण

शुक्रवार के ट्रेड्स का विश्लेषण EUR/USD का 1 घंटे का चार्ट शुक्रवार को, EUR/USD करेंसी पेयर 1.1275 और 1.1424 के बीच साइडवेज चैनल में व्यापार करता रहा। सिद्धांत रूप में

Paolo Greco 06:26 2025-05-05 UTC+2

1 मई को EUR/USD करेंसी जोड़ी पर ट्रेड कैसे करें? शुरुआती लोगों के लिए सरल टिप्स और ट्रेड विश्लेषण।

बुधवार का ट्रेड विश्लेषण: EUR/USD जोड़ी का 1 घंटे का चार्ट।. EUR/USD करेंसी जोड़ी ने बुधवार को 1 घंटे के समय फ्रेम में साइडवेज चैनल के भीतर अपने नकारात्मक आंदोलन

Paolo Greco 07:16 2025-05-01 UTC+2

1 मई को GBP/USD करेंसी जोड़ी पर ट्रेड कैसे करें? शुरुआती लोगों के लिए सरल टिप्स और ट्रेड विश्लेषण

GBP/USD जोड़ी ने बुधवार को भी नीचे की ओर हलचल दिखाई, जिसके लिए कोई ठोस कारण नहीं था। कल यूके में कोई महत्वपूर्ण घटना नहीं थी, जबकि अमेरिका ने अपनी

Paolo Greco 06:59 2025-05-01 UTC+2

30 अप्रैल को EUR/USD पेयर को कैसे ट्रेड करें? शुरुआती लोगों के लिए सरल टिप्स और ट्रेड विश्लेषण

मंगलवार के ट्रेड्स का विश्लेषण 1H चार्ट ऑफ EUR/USD मंगलवार को, EUR/USD मुद्रा जोड़ी एक साइडवेज चैनल के भीतर ट्रेड करती रही, जो अब लगभग किसी भी टाइमफ्रेम पर देखी

Paolo Greco 08:07 2025-04-30 UTC+2

30 अप्रैल को GBP/USD जोड़ी पर कैसे ट्रेड करें? शुरुआती लोगों के लिए सरल टिप्स और ट्रेड विश्लेषण

मंगलवार के ट्रेड्स का विश्लेषण GBP/USD का 1 घंटे का चार्ट मंगलवार को, GBP/USD जोड़ी सोमवार को एक और उछाल के बाद नीचे की ओर सुधार हुई। इस प्रकार की

Paolo Greco 08:03 2025-04-30 UTC+2

29 अप्रैल के लिए EUR/USD पर ट्रेडिंग सिफारिशें और विश्लेषण: यूरो की वृद्धि ने फ्लैट ट्रेंड को प्रभावित नहीं किया

EUR/USD 5-मिनट का विश्लेषण सोमवार को, EUR/USD मुद्रा जोड़ी ने दिन के दौरान एक अच्छी ऊपरी दिशा में मूवमेंट दिखाया, लेकिन यह 1.1312–1.1414 (किजुन-सेन लाइन) के संकीर्ण साइडवेज चैनल के

Paolo Greco 06:57 2025-04-29 UTC+2

24 अप्रैल को GBP/USD जोड़े पर ट्रेड कैसे करें? शुरुआती लोगों के लिए सरल टिप्स और ट्रेड विश्लेषण

बुधवार के ट्रेड्स का विश्लेषण 1 घंटे का चार्ट (GBP/USD) बुधवार को, GBP/USD जोड़ी ने EUR/USD जोड़ी की चालों का बारीकी से अनुसरण किया, जो यह और अधिक पुष्टि करता

Paolo Greco 07:12 2025-04-24 UTC+2

कैसे करें EUR/USD जोड़ी में व्यापार 24 अप्रैल को? शुरुआत करने वालों के लिए सरल टिप्स और व्यापार विश्लेषण

EUR/USD का 1 घंटे का चार्ट बुधवार को, EUR/USD मुद्रा जोड़ी मिश्रित तरीके से ट्रेड हुई। दिन के दौरान, कीमत ने कई बार दिशा बदली, और ये पलटाव मैक्रोइकोनॉमिक डेटा

Paolo Greco 07:03 2025-04-24 UTC+2
अभी बात नहीं कर सकते?
अपना प्रश्न पूछें बातचीत.
Widget callback
 

Dear visitor,

Your IP address shows that you are currently located in the USA. If you are a resident of the United States, you are prohibited from using the services of InstaFintech Group including online trading, online transfers, deposit/withdrawal of funds, etc.

If you think you are seeing this message by mistake and your location is not the US, kindly proceed to the website. Otherwise, you must leave the website in order to comply with government restrictions.

Why does your IP address show your location as the USA?

  • - you are using a VPN provided by a hosting company based in the United States;
  • - your IP does not have proper WHOIS records;
  • - an error occurred in the WHOIS geolocation database.

Please confirm whether you are a US resident or not by clicking the relevant button below. If you choose the wrong option, being a US resident, you will not be able to open an account with InstaForex anyway.

We are sorry for any inconvenience caused by this message.