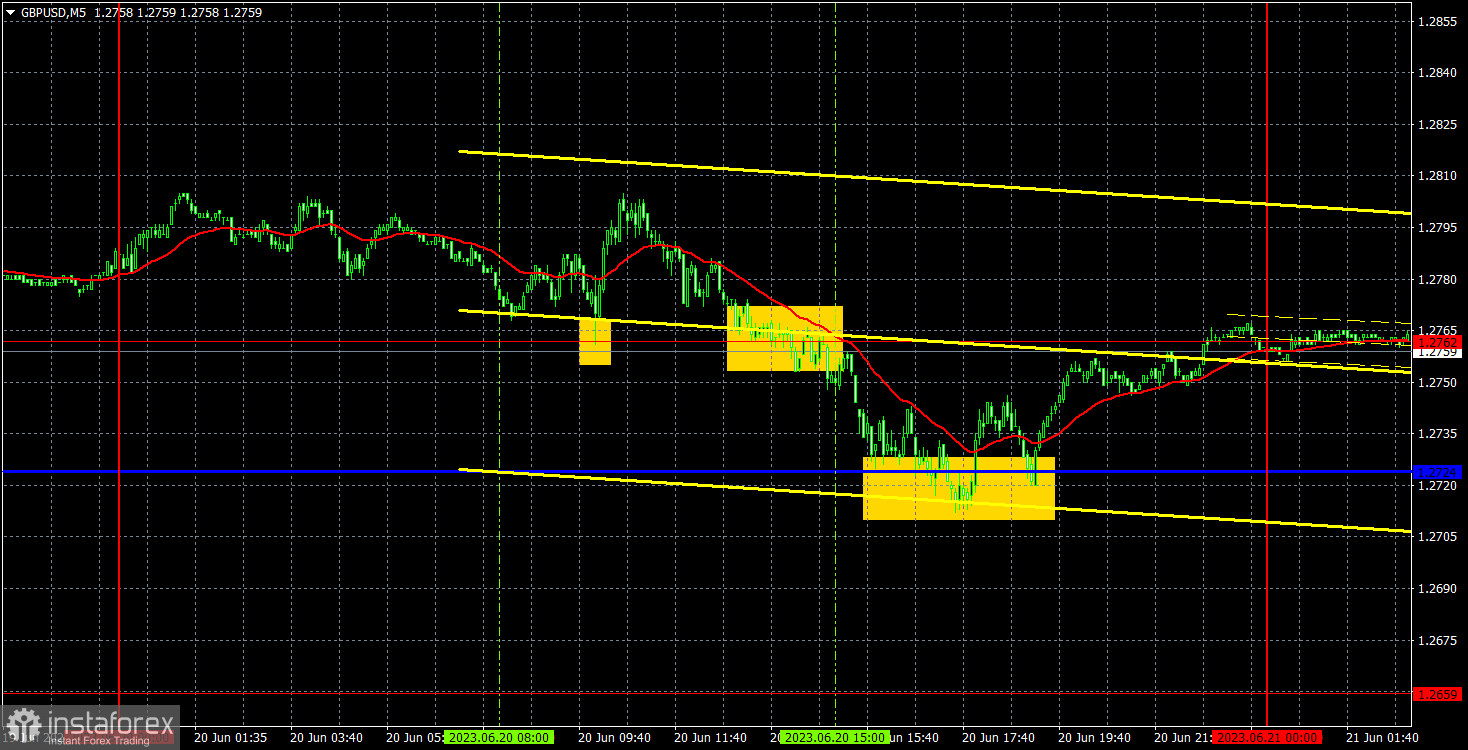
5M chart of GBP/USD
GBP/USD extended its downward movement on Tuesday, but in general, it remains stable. After a three-day correction, the pair barely managed to test the critical line without surpassing it. Thus, the uptrend persists ahead of an important inflation report in the UK, the Bank of England's meeting, and two speeches by Federal Reserve Chairman Jerome Powell in the US Congress. It is evident that these events will affect market sentiment, but it is currently impossible to determine how exactly. We need to be prepared for any developments. We believe that in the medium term, the pound should fall rather than rise, but the market currently holds a different opinion. We do not see any signs of the uptrend coming to an end.
There were several trading signals on Tuesday. Initially, the pair bounced off the level of 1.2762, providing a buy signal. Following this signal, the price moved up by about 26 pips, which was enough to set the stop-loss at breakeven. Subsequently, it settled below 1.2762, after which the pair dropped to the critical line but failed to surpass it. Consequently, it was advisable to close the short position at that point. The profit amounted to approximately 20 pips. The last buy signal appeared quite late, but you could have executed it. It resulted in an additional profit of 10-20 pips. Since volatility was relatively low, such a level of profit was acceptable.
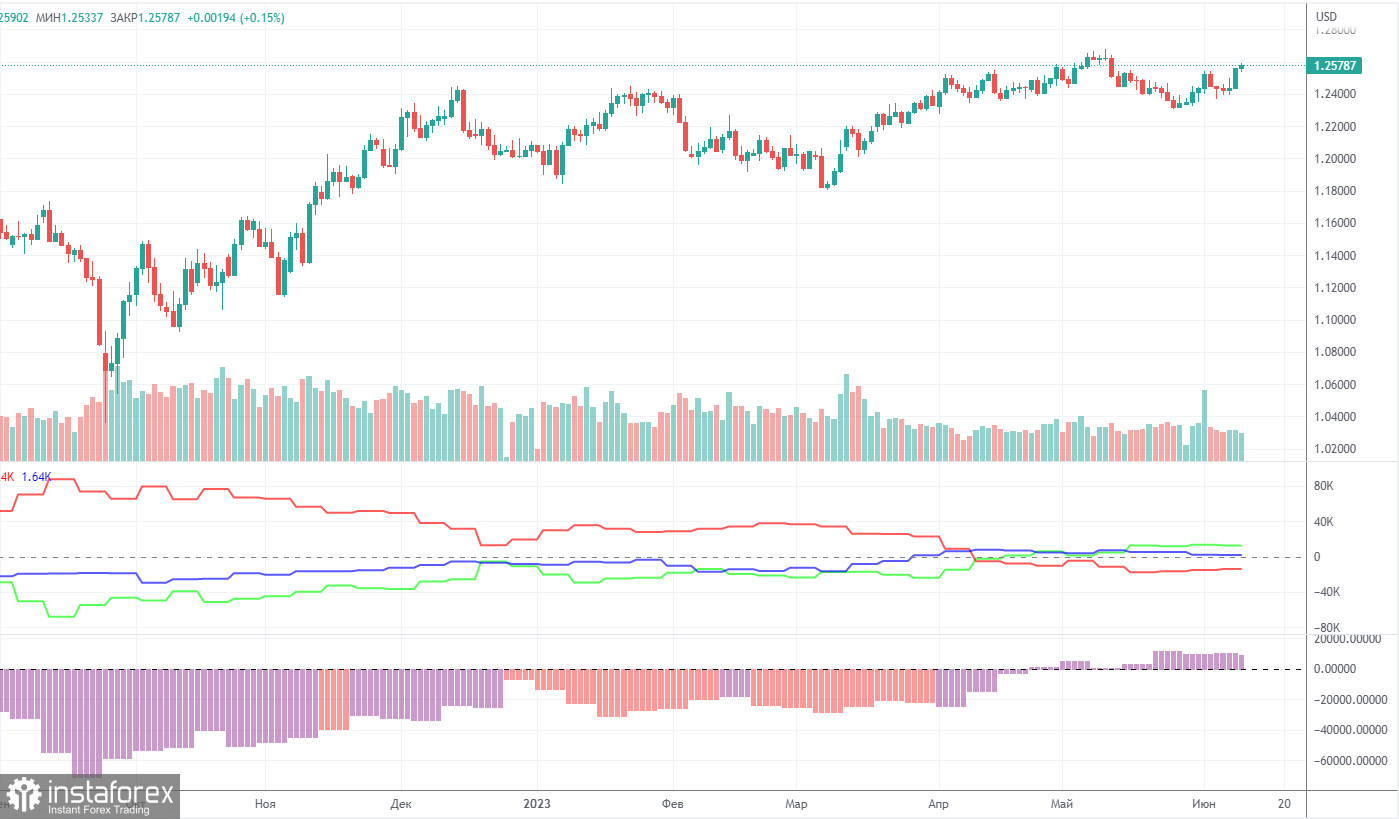
COT report:
According to the latest report, non-commercial traders closed 5,200 long positions and 4,500 short ones. The net position dropped by 700 but remained bullish. Over the past 9-10 months, the net position has been on the rise despite bearish sentiment. In fact, sentiment is now bullish, but it is a pure formality. The pound is bullish against the greenback in the medium term, but there have been hardly any reasons for that. We assume that a prolonged bear run may soon begin even though COT reports suggest a bullish continuation. However, we can hardly explain why the uptrend should go on.
The pound has gained about 2,300 pips. Therefore, a bearish correction is now needed. Otherwise, a bullish continuation would make no sense even despite the lack of support from fundamental factors. Overall, non-commercial traders hold 52,500 sell positions and 65,000 long ones. We do not see the pair extending growth in the long term.
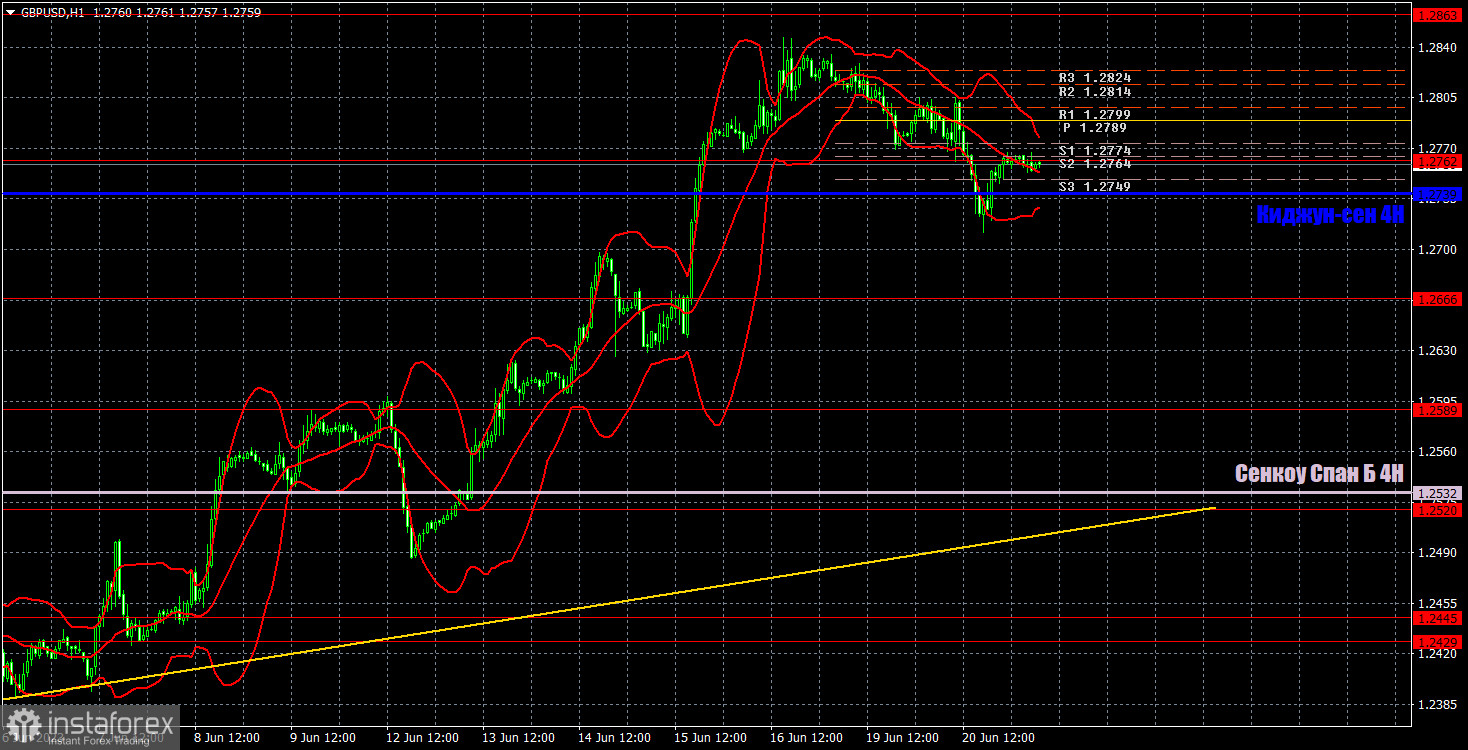
1H chart of GBP/USD
In the 1-hour chart, GBP/USD maintains a bullish bias, although it is correcting at the moment. The ascending trend line serves as a buy signal but I believe that further growth of the British currency is groundless. The pound sterling has been climbing for too long and downward corrections are short-lived (like in the last three days). Judging by the technical indicators, we have an uptrend. It is not advisable to sell the pair without proper signals. The market can sustain the trend even without a "fundamental" basis.
On June 21, trading levels are seen at 1.2349, 1.2429-1.2445, 1.2520, 1.2589, 1.2666, 1.2762, 1.2863, 1.2981-1.2987. The Senkou Span B (1.2532) and Kijun-sen (1.2739) may also generate signals when the price either breaks or bounces off them. A Stop Loss should be placed at the breakeven point when the price goes 20 pips in the right direction. Ichimoku indicator lines can move intraday, which should be taken into account when determining trading signals. There are also support and resistance which can be used for locking in profits.
On Wednesday, the UK has the most important inflation report to look forward to, and in the US - Federal Reserve Chairman Jerome Powell's first address to the Congress. Thus, it could be an interesting and volatile day. We think that a fall is more likely, but the pair also maintains a bullish bias and the market can start buying the pound again with any background.
Indicators on charts:
Resistance/support - thick red lines, near which the trend may stop. They do not make trading signals.
The Kijun-sen and Senkou Span B lines are the Ichimoku indicator lines moved to the hourly timeframe from the 4-hour timeframe. They are also strong lines.
Extreme levels are thin red lines, from which the price used to bounce earlier. They can produce trading signals.
Yellow lines are trend lines, trend channels, and other technical patterns.
Indicator 1 on the COT chart is the size of the net position of each trader category.
Indicator 2 on the COT chart is the size of the net position for the Non-commercial group of traders.