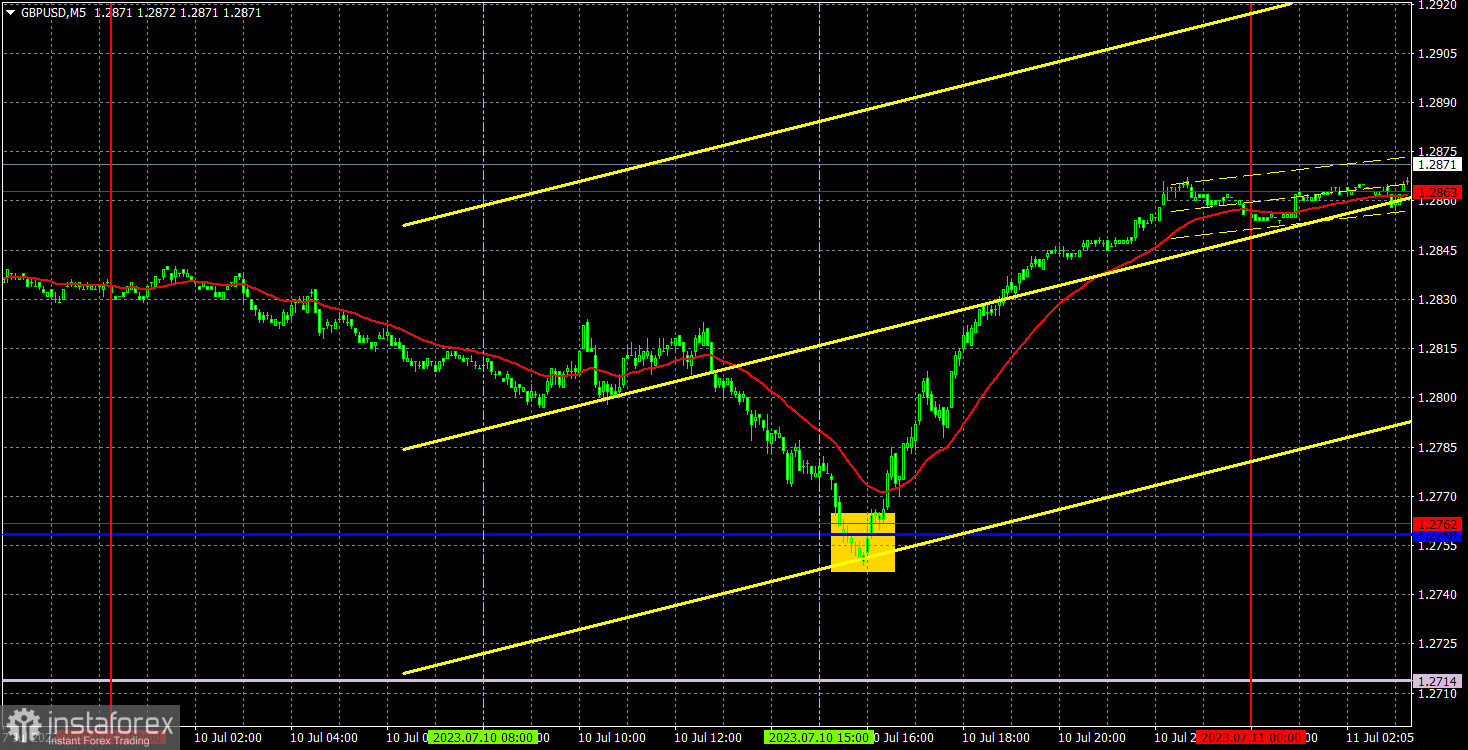
5M chart of GBP/USD
The GBP/USD jumped solidly upwards on Monday, with volatility exceeding the 100-point mark. A speech by Bank of England governor Andrew Bailey was scheduled in the UK yesterday, but it was planned for the evening, so it couldn't have any influence on the pair's movement during the day. Nevertheless, in the second half of the day, the dollar slumped, which we can associate with the upcoming US inflation report, which already suggests a sharp slowdown to 3.1%. If the forecasts come true, then this report is already accounted for, and the likelihood of two more rate hikes in 2023 will drastically decrease. Theoretically, the broad US dollar weakness is logical, but let's also remember that this pattern is not always observed. The market still uses any excuse to buy the pair. The momentum persists.
There was only one entry point yesterday. At the beginning of the US session, the pair bounced off the 1.2762 level and the Kijun-sen line of the Ichimoku indicator, afterwards it rose to the 1.2863 level. The long position should have been closed manually closer to the evening, so the profit on it was about 70 points. An excellent trading day!
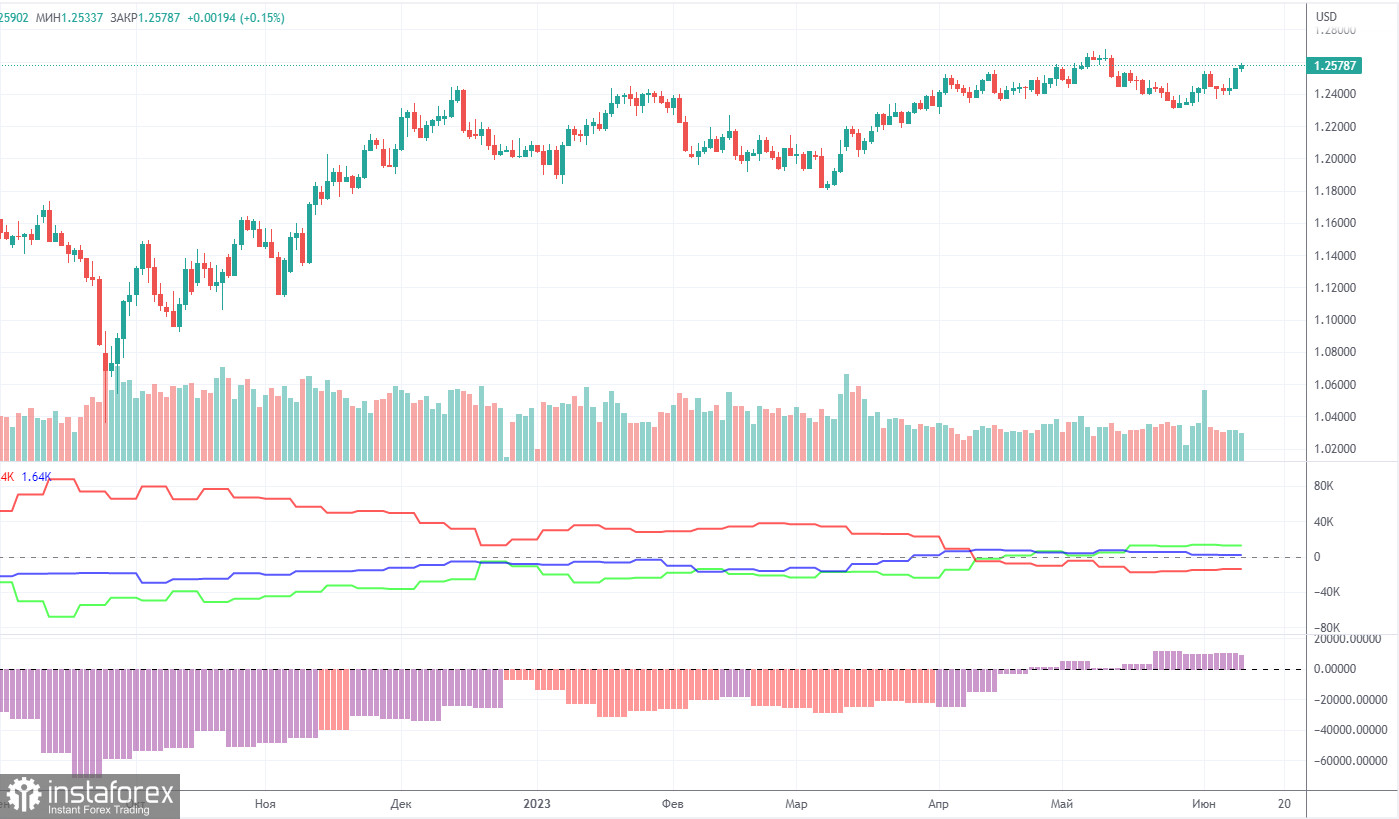
COT report:
According to the latest report, the "Non-commercial" group of traders closed 7,900 long positions and 6,100 short ones. Thus, the net position of non-commercial traders decreased by 1,800 positions in a week but in general it continued to rise. The net position has been steadily growing over the past 10 months as well as the pound sterling. Now, the net position has advanced markedly. This is why the pair will hardly maintain its bullish momentum. I believe that a long and protracted downward movement should begin. COT reports signal a slight growth of the British currency but it will not be able to rise in the long term. There are no drivers for opening new long positions. However, there are no technical signals for short positions yet.
The British currency has already grown by a total of 2,500 pips. Without a downward correction, the continuation of the uptrend will be illogical. The Non-commercial group of traders has opened 96,500 long positions and 46,100 short ones. Such a gap means the end of the uptrend. I remain skeptical about the long-term growth of the pound sterling but speculators continue to buy because the pair is growing. Usually, BTC shows such movements.
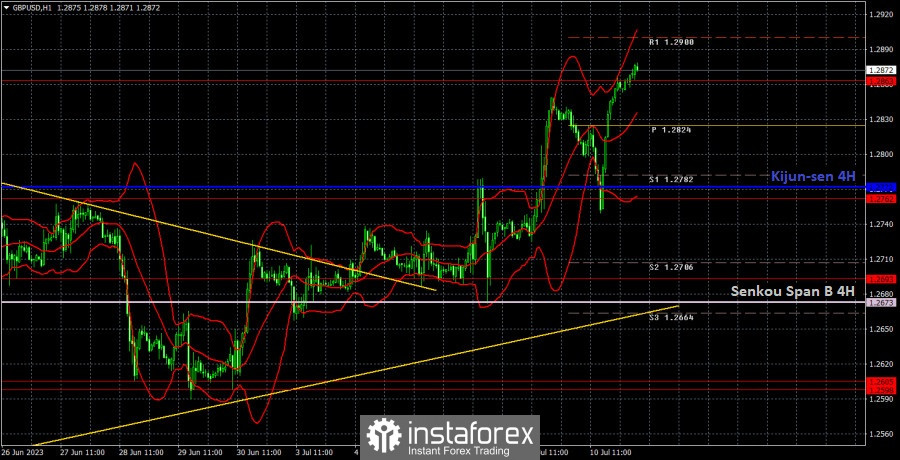
1H chart of GBP/USD
In the 1-hour chart, GBP/USD maintains a bullish bias. The ascending trend line serves as a buy signal. So, traders are opening new long positions. However, the pound sterling is overbought. It is likely to decline in the medium term. Yet, it surpassed the descending trend line. Hence, it could move to new highs. Yet, it surpassed the descending trend line. Hence, it could move to new highs. According to the technical analysis, the pound sterling has drivers for a further increase. And the market is happy to take any opportunity to sell the dollar.
On July 11, trading levels are seen at 1.2349, 1.2429-1.2445, 1.2520, 1.2598-1.2605, 1.2693, 1.2762, 1.2863, 1.2981-1.2987. Senkou Span B (1.2714) and Kijun-sen (1.2719) lines can also provide signals, e.g. rebounds and breakout of these levels and lines. It is recommended to set the Stop Loss orders at the breakeven level when the price moves in the right direction by 20 pips. The lines of the Ichimoku indicator can move during the day, which should be taken into account when determining trading signals. There are support and resistance levels that can be used to lock in profits.
On Tuesday, the UK will publish at least three reports that could stir some market reaction. Jobless claims, unemployment and payrolls. We believe that the unemployment data may have an impact on the traders' mood. If they turn out to be optimistic, the pound will receive a new opportunity to extend its upward movement.
Indicators on charts:
Resistance/support - thick red lines, near which the trend may stop. They do not make trading signals.
The Kijun-sen and Senkou Span B lines are the Ichimoku indicator lines moved to the hourly timeframe from the 4-hour timeframe. They are also strong lines.
Extreme levels are thin red lines, from which the price used to bounce earlier. They can produce trading signals.
Yellow lines are trend lines, trend channels, and other technical patterns.
Indicator 1 on the COT chart is the size of the net position of each trader category.
Indicator 2 on the COT chart is the size of the net position for the Non-commercial group of traders.