empty
21.09.2023 03:50 PM
EUR/CHF dynamics scenarios on September 21, 2023

This image is no longer relevant

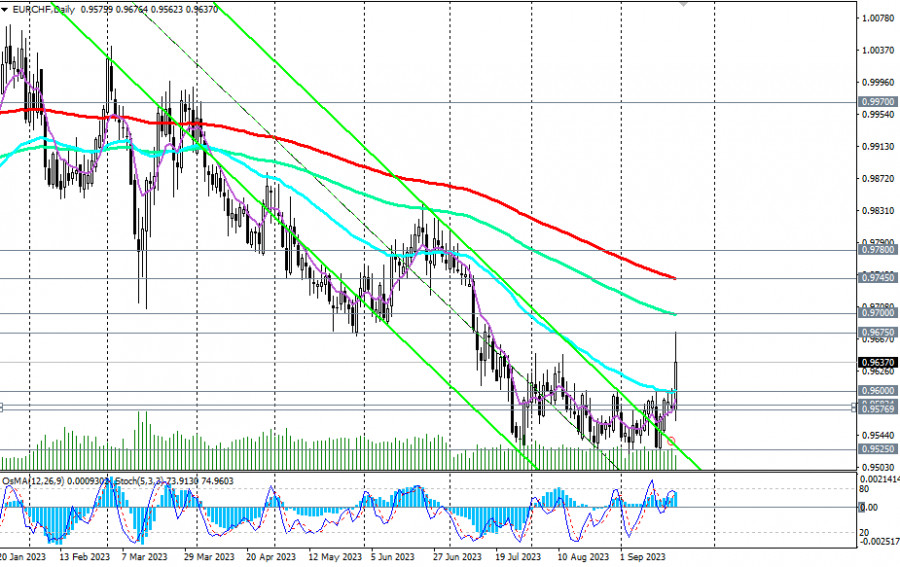
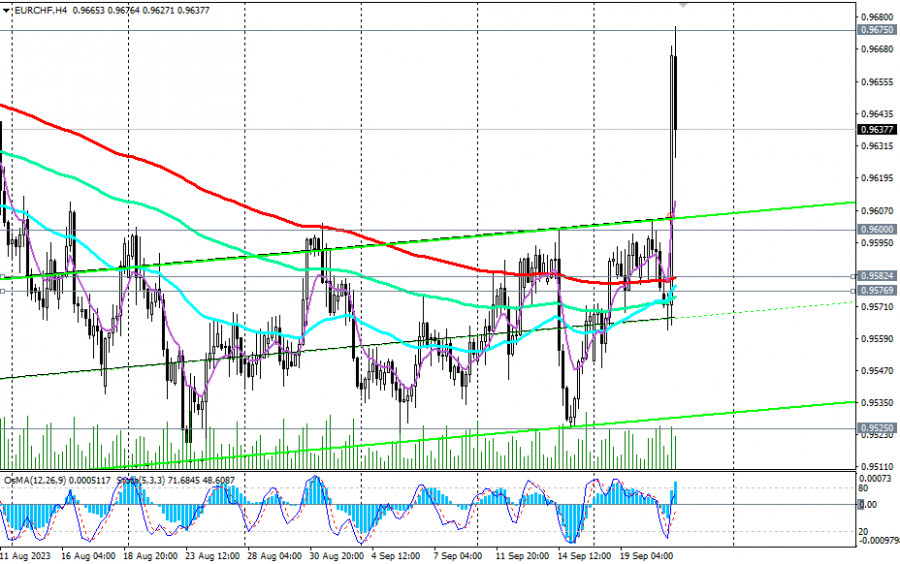
The EUR/CHF dynamics are dominated by a long-term bearish trend. Today, the pair sharply strengthened after the Swiss National Bank's meeting, where the bank's leaders left the deposit rate at 1.75%, although economists expected an increase of 0.25% to 2.00%. Despite the bank's statement that "further tightening of monetary policy may be required in the medium term, and additional interest rate hikes are not ruled out," the market reacted negatively to this decision. The Swiss Franc sharply weakened immediately after the announcement, and EUR/CHF reached its highest point since mid-July, at 0.9675.

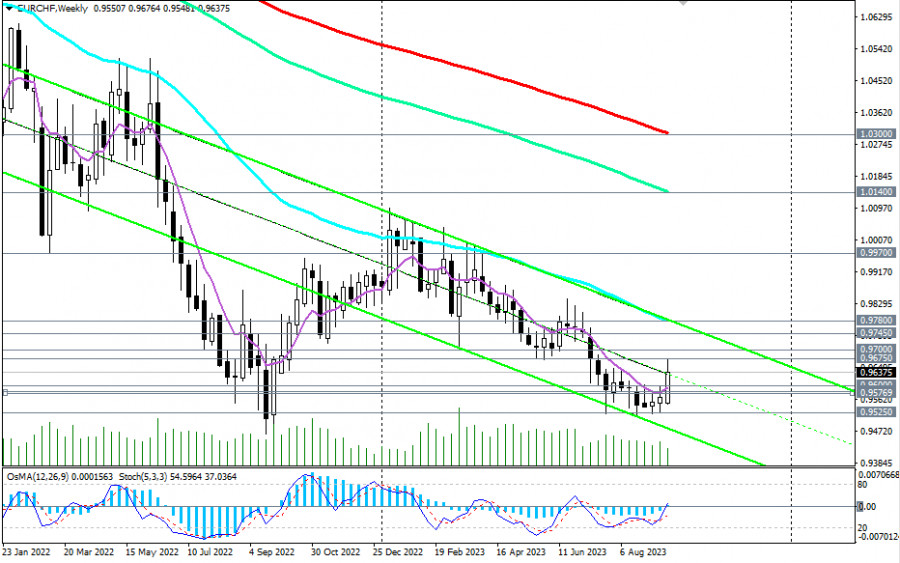
In the subsequent hours, EUR/CHF declined, and the pair is generally trading in a bearish market, both in the long-term and medium-term, below key resistance levels of 1.1800 (200 EMA on the monthly chart), 1.0300 (200 EMA on the weekly chart), and 0.9745 (200 EMA on the daily chart).

This image is no longer relevant

As of writing, the pair is trading near the 0.9635 level, declining from the reached high of 0.9675.

A break below important support levels such as 0.9600 (50 EMA on the daily chart), 0.9582 (200 EMA on the 4-hour chart), and 0.9577 (200 EMA on the 1-hour chart) would signify a return of EUR/CHF to the downward trend. And below the local support level of 0.9525, the pair will return within the downward channel on the daily chart, with its lower boundary near the 0.9300 mark. This would serve as the target for long-term sellers of this currency pair.

This image is no longer relevant

In an alternative scenario, EUR/CHF may still develop an upward correction above today's high of 0.9675. In this case, a breakout of key resistance levels at 0.9745 and 0.9780 (50 EMA and the upper boundary of the downward channel on the weekly chart) would mean a return of EUR/CHF to the medium-term bullish market zone with prospects for growth towards local resistance levels at 0.9970 and 1.0000. Rising towards levels above 1.0200 and 1.0300 resistance levels would lead EUR/CHF into the long-term bullish market zone.

In the main scenario, we expect a resumption of the pair's decline. Short positions remain preferable below the resistance levels of 0.9745 and 0.9780.

Support levels: 0.9600, 0.9582, 0.9577, 0.9525, 0.9500, 0.9400, 0.9300

Resistance levels: 0.9675, 0.9700, 0.9745, 0.9780, 0.9800, 0.9900, 0.9970, 1.0000, 1.0140, 1.0300

Jurij Tolin,
InstaForex के विश्लेषणात्मक विशेषज्ञ
© 2007-2025
समय सीमा चुनें
5
मिनट
15
मिनट
30
मिनट
1
घंटा
4
घंटे
1
दिन
1
सप्ताह
Earn on cryptocurrency rate changes with InstaForex
Download MetaTrader 4 and open your first trade
  • Grand Choice
    Contest by
    InstaForex
    InstaForex always strives to help you
    fulfill your biggest dreams.
    कॉन्टेस्ट में हिस्सा लें

अनुशंसित लेख

27 मार्च को GBP/USD जोड़ी में कैसे ट्रेड करें? शुरुआती लोगों के लिए सरल सुझाव और ट्रेड विश्लेषण

बुधवार के ट्रेडों का विश्लेषण GBP/USD का 1H चार्ट बुधवार को, GBP/USD जोड़ी ने नीचे की ओर गति दिखाई जो अंततः व्यापक आर्थिक पृष्ठभूमि के साथ संरेखित हुई। दिन के

Paolo Greco 18:24 2025-03-27 UTC+2

27 मार्च को EUR/USD जोड़ी में कैसे ट्रेड करें? शुरुआती लोगों के लिए सरल सुझाव और ट्रेड विश्लेषण

बुधवार के ट्रेडों का विश्लेषण EUR/USD का 1H चार्ट बुधवार को, EUR/USD मुद्रा जोड़ी ने अपनी सुस्त गिरावट जारी रखी। यूरो का मूल्यह्रास काफी तार्किक है, हालांकि व्यापारी अधिकांश व्यापक

Paolo Greco 18:24 2025-03-27 UTC+2

EUR/USD: 26 मार्च के अमेरिकी सत्र के लिए ट्रेडिंग योजना (सुबह के ट्रेडों की समीक्षा)

अपने सुबह के पूर्वानुमान में, मैंने 1.2926 के स्तर पर प्रकाश डाला और इसके आधार पर ट्रेडिंग निर्णय लेने की योजना बनाई। आइए 5 मिनट के चार्ट को देखें

Miroslaw Bawulski 18:57 2025-03-26 UTC+2

EUR/USD: 26 मार्च के अमेरिकी सत्र के लिए ट्रेडिंग योजना (सुबह के ट्रेडों की समीक्षा)

अपने सुबह के पूर्वानुमान में, मैंने 1.0780 के स्तर पर प्रकाश डाला और इसके आधार पर बाजार में प्रवेश के निर्णय लेने की योजना बनाई। आइए 5-मिनट के चार्ट को

Miroslaw Bawulski 18:57 2025-03-26 UTC+2

25 मार्च को EUR/USD जोड़ी में कैसे ट्रेड करें? शुरुआती लोगों के लिए सरल सुझाव और ट्रेड विश्लेषण

सोमवार के ट्रेडों का विश्लेषण EUR/USD का 1H चार्ट EUR/USD मुद्रा जोड़ी ने सोमवार को अपनी कमज़ोर गिरावट जारी रखी। दिन के अंत तक डॉलर में कोई खास बढ़त नहीं

Paolo Greco 17:51 2025-03-25 UTC+2

25 मार्च को GBP/USD जोड़ी में कैसे ट्रेड करें? शुरुआती लोगों के लिए सरल सुझाव और ट्रेड विश्लेषण

सोमवार के ट्रेडों का विश्लेषण GBP/USD का 1H चार्ट GBP/USD जोड़ी ने सोमवार को ऊपर और नीचे दोनों तरफ कारोबार किया। ऊपर की ओर रुझान बरकरार है, जो एक महीने

Paolo Greco 17:48 2025-03-25 UTC+2

25 मार्च को EUR/USD के लिए ट्रेडिंग अनुशंसाएं और विश्लेषण: डॉलर में बाधाओं के मुकाबले मजबूती

सोमवार को, EUR/USD मुद्रा जोड़ी ने शुरू में ऊपर की ओर गति दिखाई, उसके बाद गिरावट आई, जिससे पूरा कारोबारी दिन कुछ हद तक विरोधाभासी हो गया। पूरे दिन

Paolo Greco 17:48 2025-03-25 UTC+2

GBP/USD: 24 मार्च के अमेरिकी सत्र के लिए ट्रेडिंग योजना (सुबह के ट्रेडों की समीक्षा)

अपने सुबह के पूर्वानुमान में, मैंने 1.2968 के स्तर पर प्रकाश डाला और इसके आधार पर ट्रेडिंग निर्णय लेने की योजना बनाई। आइए 5-मिनट के चार्ट को देखें और विश्लेषण

Miroslaw Bawulski 18:42 2025-03-24 UTC+2

EUR/USD: 24 मार्च के अमेरिकी सत्र के लिए ट्रेडिंग योजना (सुबह के ट्रेडों की समीक्षा)

अपने सुबह के पूर्वानुमान में, मैंने 1.0856 के स्तर को हाइलाइट किया और इसके आधार पर ट्रेडिंग निर्णय लेने की योजना बनाई। आइए 5-मिनट के चार्ट पर नज़र डालें

Miroslaw Bawulski 18:42 2025-03-24 UTC+2

21 मार्च को GBP/USD जोड़ी में कैसे व्यापार करें? शुरुआती व्यापारियों के लिए सरल टिप्स और व्यापार विश्लेषण

गुरुवार के ट्रेड्स का विश्लेषण GBP/USD का 1 घंटे का चार्ट GBP/USD जोड़ी ने गुरुवार को भी नीचे की ओर मूवमेंट दिखाई, लेकिन बुधवार शाम को पाउंड ने स्थिर रूप

Paolo Greco 07:54 2025-03-21 UTC+2
अभी बात नहीं कर सकते?
अपना प्रश्न पूछें बातचीत.
Widget callback
 

Dear visitor,

Your IP address shows that you are currently located in the USA. If you are a resident of the United States, you are prohibited from using the services of InstaFintech Group including online trading, online transfers, deposit/withdrawal of funds, etc.

If you think you are seeing this message by mistake and your location is not the US, kindly proceed to the website. Otherwise, you must leave the website in order to comply with government restrictions.

Why does your IP address show your location as the USA?

  • - you are using a VPN provided by a hosting company based in the United States;
  • - your IP does not have proper WHOIS records;
  • - an error occurred in the WHOIS geolocation database.

Please confirm whether you are a US resident or not by clicking the relevant button below. If you choose the wrong option, being a US resident, you will not be able to open an account with InstaForex anyway.

We are sorry for any inconvenience caused by this message.