Analyzing Tuesday's trades:
GBP/USD on 1H chart
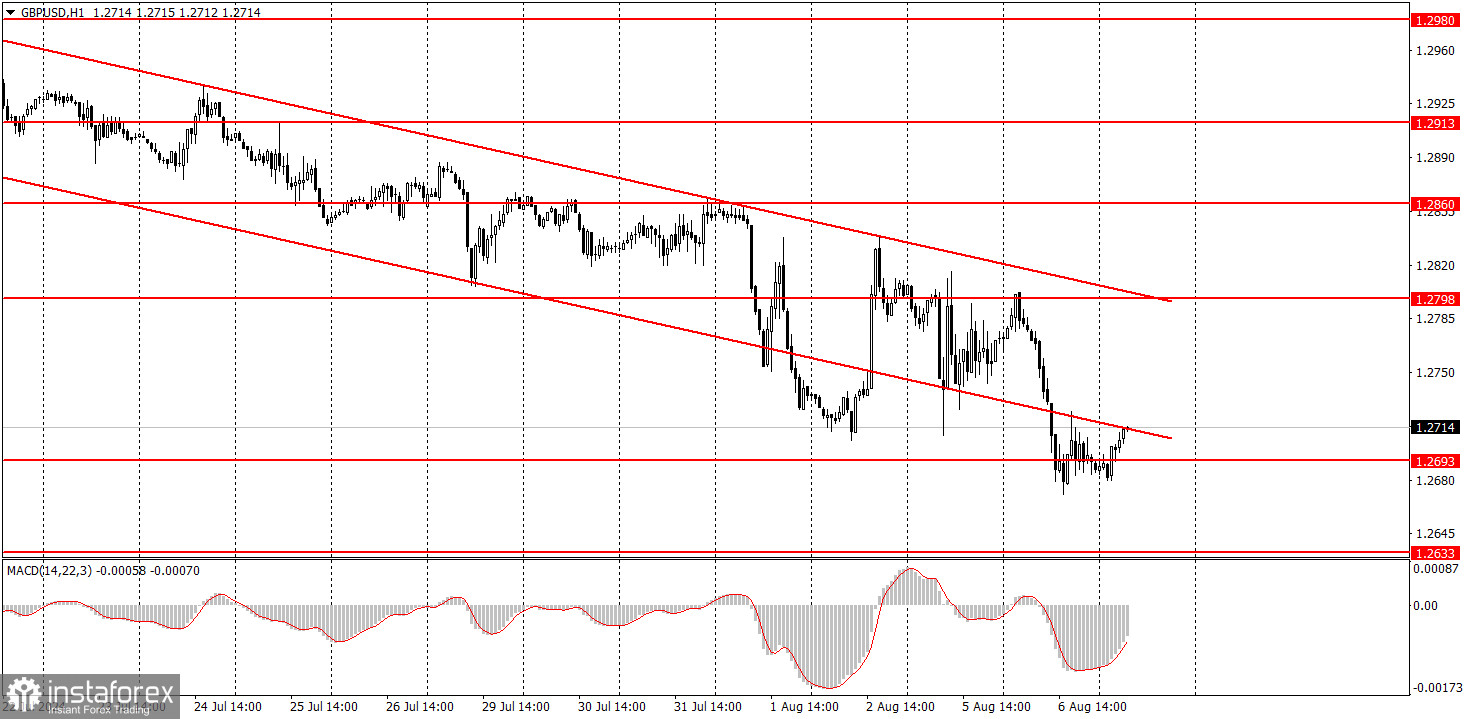
On Tuesday, the GBP/USD pair again showed a noticeable drop. There were no macroeconomic or fundamental reasons for such movement yesterday, but overall, we still expect the pound to fall. By the way, the euro and the pound have been trading differently recently. While the euro tended to rise, the pound tended to decline. Why, if the market expects emergency intervention from the Federal Reserve or a rate cut by as much as 0.5% in September?
The British pound is currently falling because the global downward trend persists. Over the last 9-10 months, it has risen much more often than it should have, but the state of the British economy is no better than the American one. The market is also expecting the Fed to maximize and expedite monetary policy easing, and yet the Bank of England is the one who is lowering borrowing costs. Of course, upward corrections will also occur, but identifying the first of these requires at least a consolidation above the descending channel.
GBP/USD on 5M chart
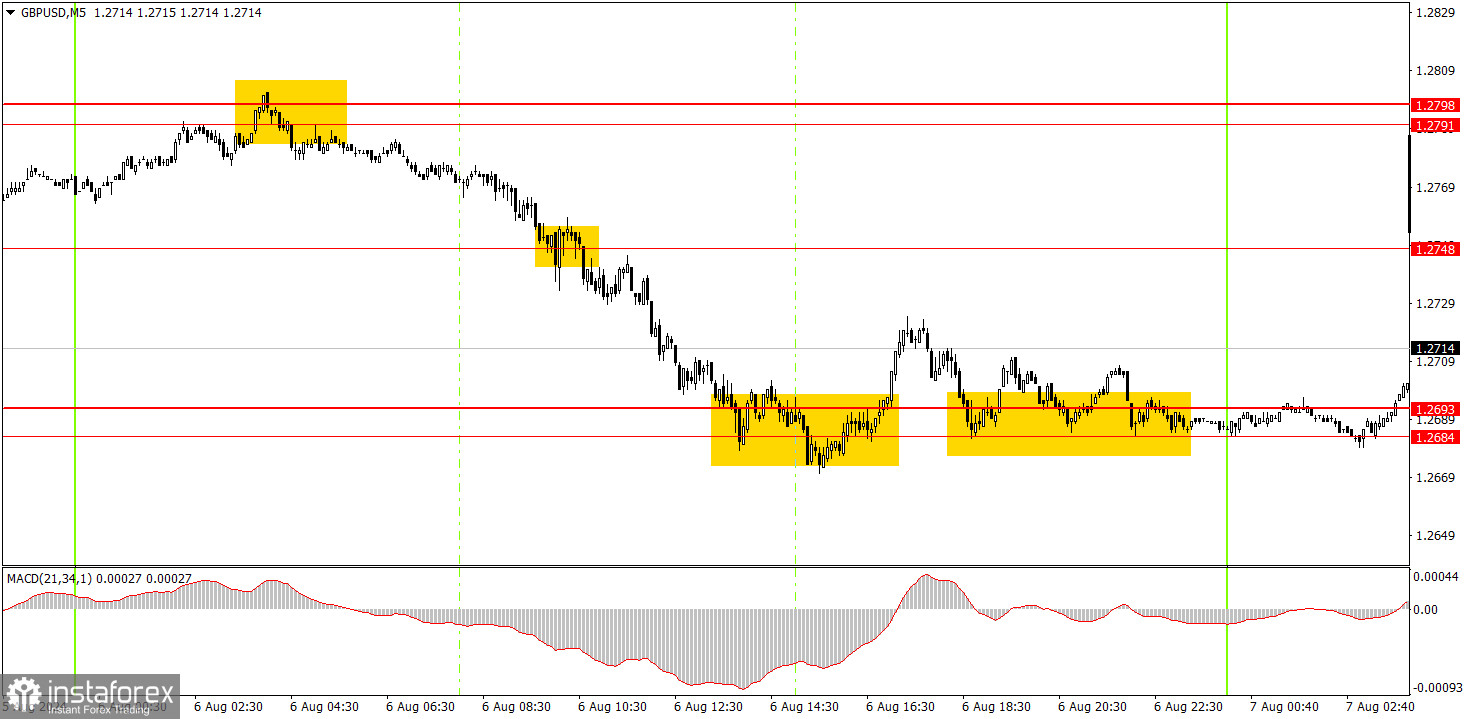
Several good signals were formed in the 5-minute time frame on Tuesday. These signals formed because the British pound showed volatility of over 100 pips on the fourth consecutive day. Since there are movements in the market, strong and sufficient signals are formed. An ideal rebound from the area of 1.2791-1.2801 was formed overnight, which could have been traded at the opening of the European session. Afterward, the price fell to 1.2684-1.2693, where traders should have taken profits on short positions. The rebound from the specified area did not lead to solid growth, but it might today, as there have been several rebounds.
Trading tips on Wednesday:
GBP/USD has a good chance of sustaining its downtrend in the hourly time frame. The British pound is still overbought, the dollar is undervalued, and the BoE has started lowering its borrowing costs—what more is needed to sustain the pound's decline? The US macro data once again spoiled the perfect picture for the dollar. However, at the same time, disappointing US reports will not come every day. Currently, the main risk for the dollar is a possible emergency rate cut by the Fed. But for now, these are just rumors.
On Wednesday, novice traders can trade from the areas of 1.2684-1.2693 and 1.2748. The pair rebounded from this area several times yesterday and today, so the pound will likely rise today.
The key levels to consider on the 5M timeframe are 1.2547, 1.2605-1.2633, 1.2684-1.2693, 1.2748, 1.2791-1.2798, 1.2848-1.2860, 1.2913, 1.2980-1.2993, 1.3043, 1.3102-1.3107, 1.3145. No significant events are scheduled on Wednesday in the United Kingdom or the United States, so nothing should impede an upward correction.
Basic rules of a trading system:
1) The strength of a signal is determined by the time it took for the signal to form (bounce or level breakthrough). The shorter the time required, the stronger the signal.
2) If two or more trades around a certain level are initiated based on false signals, subsequent signals from that level should be ignored.
3) In a flat market, any currency pair can produce multiple false signals or none at all. In any case, it's better to stop trading at the first signs of a flat market.
4) Trades should be opened between the start of the European session and mid-way through the U.S. session. All trades must be closed manually after this period.
5) In the hourly time frame, trades based on MACD signals are only advisable amidst substantial volatility and an established trend, confirmed either by a trendline or trend channel.
6) If two levels are too close to each other (from 5 to 20 pips), they should be considered as a support or resistance zone.
7) After moving 15 pips in the intended direction, the Stop Loss should be set to break-even.
What's on the charts:
Support and Resistance price levels: targets when opening long or short positions. You can place Take Profit levels near them.
Red lines represent channels or trend lines that depict the current trend and indicate the preferred trading direction.
The MACD (14,22,3) indicator, encompassing both the histogram and signal line, acts as an auxiliary tool and can also be used as a source of signals.
Important speeches and reports (always noted in the news calendar) can profoundly influence the price dynamics. Hence, trading during their release calls for heightened caution. It may be reasonable to exit the market to prevent abrupt price reversals against the prevailing trend.
Beginners should always remember that not every trade will yield profit. Establishing a clear strategy, coupled with effective money management, is key to long-term success in trading.