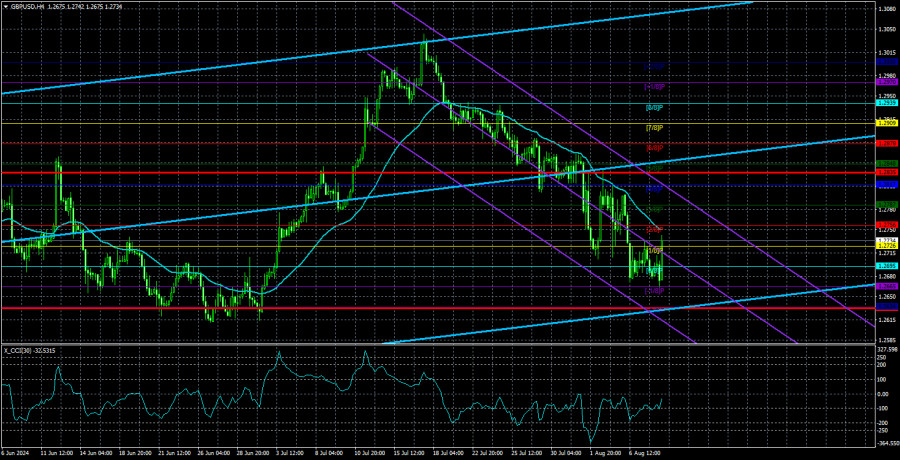
The GBP/USD pair traded sideways for most of Thursday and only managed to edge up towards the evening. This minor rise cannot be called "the beginning of a strong upward movement," but it may be the start of a correction. Recall that the CCI indicator entered the oversold area, and the British pound had fallen for three consecutive weeks, which was somewhat surprising. However, when shifting to the 24-hour time frame, all surprise dissipates. The British pound has been on an upward trend for almost a year, although there have been mostly no reasons for this. The Bank of England ultimately began easing monetary policy even before the Federal Reserve, which was hard to believe at the beginning of the year. But the fact remains. Unlike the Fed, the BoE might continue to lower rates, as inflation at 2% allows it to do so.
Therefore, in the medium term, we maintain our forecast of sustained declines for the pound. While many analysts hold a different view, repeatedly suggesting that the Fed will soon start lowering its rate, we have been hearing this since January, and the situation remains unchanged. We do not believe that the current state of the American economy and labor market is so dire that the Fed has no choice but to start easing. Hence, we have our doubts about the central bank's decision to lower the rate in September.
Even if this happens, the market has already priced in how many rate cuts? Two? Three? In any case, the pound has risen too strongly against the dollar. And, let's remember that the current, almost yearly growth is still a correction against a more substantial, preceding decline, as seen in the daily time frame. Yes, the correction has taken a somewhat unusual form, but various corrections occur in the currency market.
We also admit that the illogical growth of the British currency will be replaced by an illogical (for many traders) decline. It would be nice for market makers to start pushing the pair downward when everyone expects it to rise. It would be great if the dollar started to appreciate when the Fed begins to lower rates. Let's recall that the dollar started depreciating when the first rumors appeared last year that the US central bank might begin monetary easing. This once again proves the effectiveness of the rule "buy the rumor, sell the news." The market "oversold" the dollar on rumors, and now it may begin to buy on facts.
We believe that further growth of the GBP/USD pair is unclear, and the economic reports in the United Kingdom are no better than those in the US. Therefore, this factor does not work in favor of the British pound.
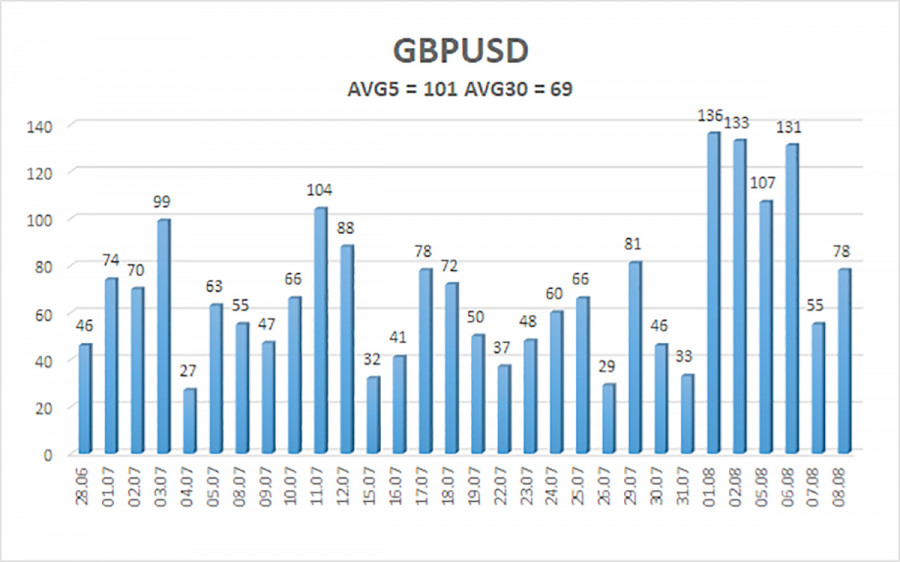
The average volatility of GBP/USD over the last five trading days is 101 pips. This is considered an average value for the pair. On Friday, August 9, we expect movement within the range limited by 1.2633 and 1.2835. The higher linear regression channel is directed upwards, signaling the continuation of the upward trend. The CCI indicator has formed oversold conditions, but we do not yet expect a substantial rise from the pound. However, a bullish divergence has also been formed. A correction may start.
Nearest Support Levels:
- S1 – 1.2695
- S2 – 1.2665
- S3 – 1.2634
Nearest Resistance Levels:
- R1 – 1.2726
- R2 – 1.2756
- R3 – 1.2787
Trading Recommendations:
The GBP/USD pair remains below the moving average line and has a good chance of sustaining its bearish momentum. Short positions remain valid with initial targets at 1.2665 and 1.2634. We are not considering long positions at this time, as we believe that the market has already processed all the bullish factors for the British currency (which are not much) multiple times. The pound sterling may only begin to correct next week, as indicated by the CCI entering the oversold area and forming a bullish divergence.
Explanations for Illustrations:
Linear Regression Channels: help determine the current trend. If both are directed in the same direction, it means the trend is strong.
Moving Average Line (settings 20,0, smoothed): determines the short-term trend and the direction in which trading should be conducted.
Murray Levels: target levels for movements and corrections.
Volatility Levels (red lines): the probable price channel in which the pair will spend the next 24 hours, based on current volatility indicators.
CCI Indicator: Entering the oversold area (below 250) or the overbought area (above +250) means a trend reversal is approaching.


