Analyzing Tuesday's trades:
GBP/USD on 1H chart
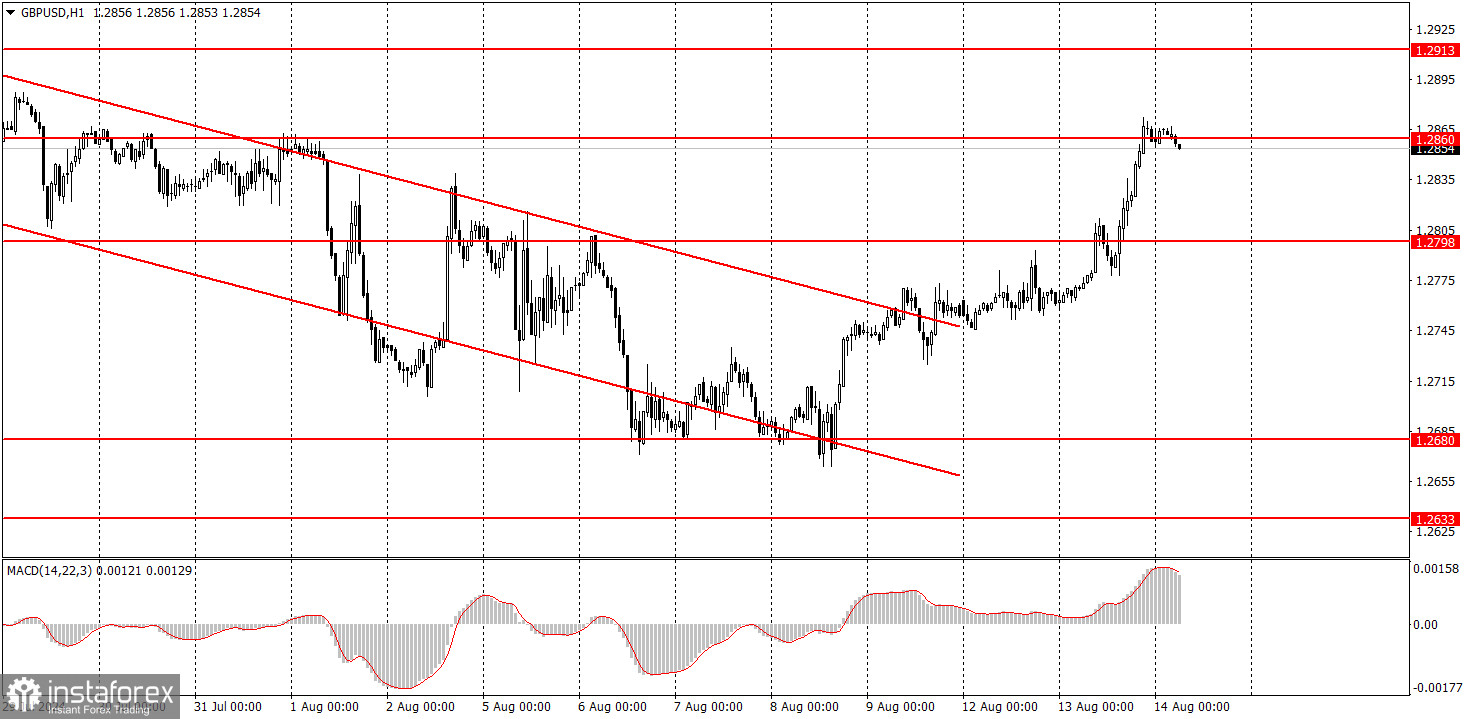
The GBP/USD pair also showed strong upward movement on Tuesday. In addition to the Producer Price Index, which triggered the prominent rise of the pair, reports on unemployment, unemployment claims, and wages were published in the UK. The unemployment rate unexpectedly decreased from 4.4% to 4.2%, while the market had expected it to rise to 4.5%. After this report, it became irrelevant that the number of unemployment claims exceeded the forecast nine times and that wage growth slowed by more than 1% (which approaches the timing of a second rate cut by the Bank of England). As it tended to do in 2024, the market ignored all the data supporting the dollar and reacted only to the report that supported the pound.
We have already mentioned the Producer Price Index. The 0.1% greater-than-expected slowdown in the indicator led to a virtual collapse of the dollar. Today, if U.S. inflation slows to 2.9%, we can expect a new collapse of the American currency.
GBP/USD on 5M chart
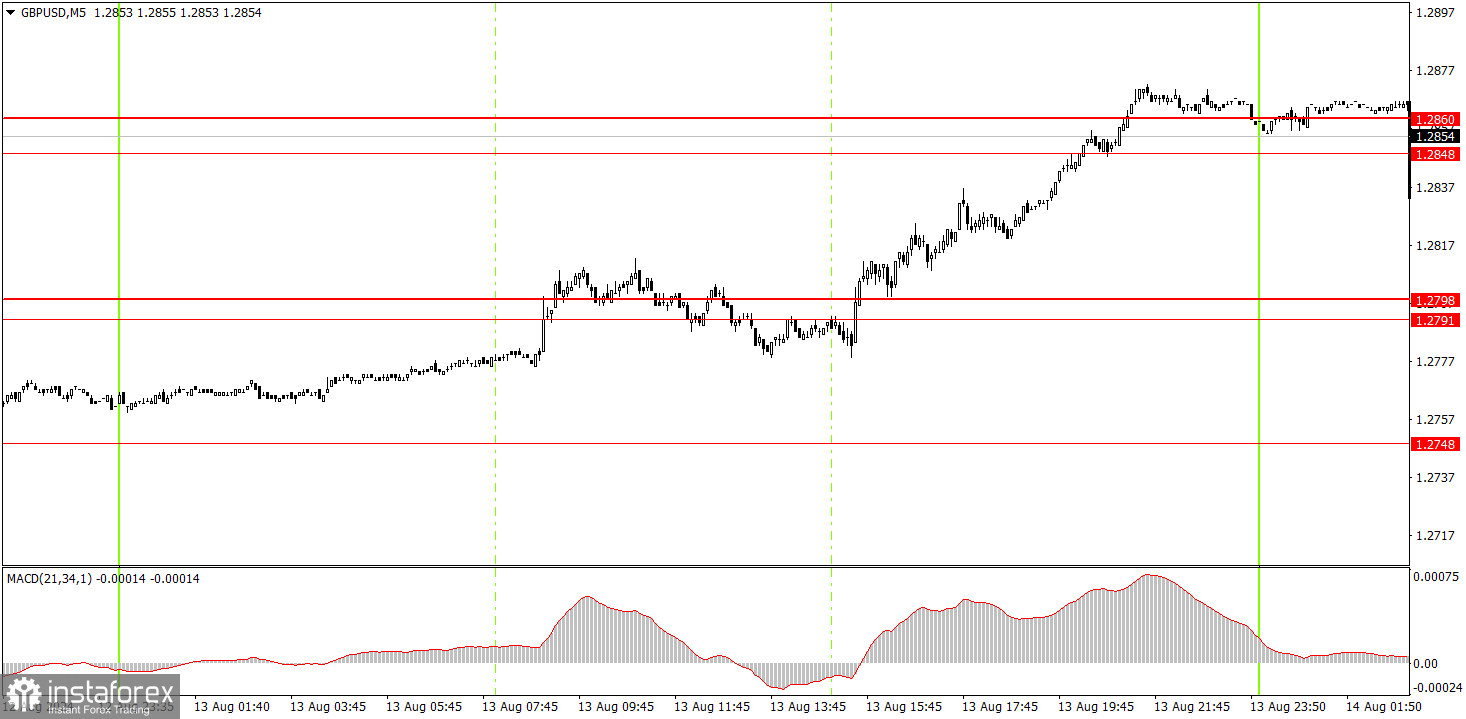
In the 5-minute time frame, the movements were "remarkable" on Tuesday. Not only did the market completely ignore all data that supported the dollar, but it also began consolidating around the important area of 1.2791-1.2798. During the European trading session, it was extremely difficult to consider the consolidation below or above this area as a signal. During the U.S. session, the price firmly established itself above this area and bounced from it from the top. Therefore, in this case, long positions could have been opened. By the end of the day, the next area of 1.2848–1.2860 was reached, where profits should have been taken.
Trading tips on Wednesday:
In the hourly time frame, GBP/USD has a good chance of sustaining the downtrend but is going through an upward correction. The British pound is still overbought, while the dollar is undervalued, and the market continues to use every opportunity to buy the British currency. It simply ignores any unfavorable reports. Today, a new dollar collapse can be expected if the U.S. inflation report shows a sharper slowdown than the market anticipates.
On Wednesday, beginners might trade from the 1.2848–1.2860 area. The UK inflation report will be published in a few hours, which might trigger a market reaction. Therefore, a price consolidation below this area is quite possible. During the U.S. session, a new upward move might occur.
The key levels to consider on the 5M timeframe are 1.2547, 1.2605–1.2633, 1.2684–1.2693, 1.2748, 1.2791–1.2798, 1.2848–1.2860, 1.2913, 1.2980–1.2993, 1.3043, 1.3102–1.3107, and 1.3145. On Wednesday, the UK and the US will release their inflation reports. Therefore, movements today could be quite strong again.
Basic rules of a trading system:
1) The strength of a signal is determined by the time it took for the signal to form (bounce or level breakthrough). The shorter the time required, the stronger the signal.
2) If two or more trades around a certain level are initiated based on false signals, subsequent signals from that level should be ignored.
3) In a flat market, any currency pair can produce multiple false signals or none at all. In any case, it's better to stop trading at the first signs of a flat market.
4) Trades should be opened between the start of the European session and mid-way through the U.S. session. All trades must be closed manually after this period.
5) In the hourly time frame, trades based on MACD signals are only advisable amidst substantial volatility and an established trend, confirmed either by a trendline or trend channel.
6) If two levels are too close to each other (from 5 to 20 pips), they should be considered as a support or resistance zone.
7) After moving 15 pips in the intended direction, the Stop Loss should be set to break-even.
What's on the charts:
Support and Resistance price levels: targets when opening long or short positions. You can place Take Profit levels near them.
Red lines represent channels or trend lines that depict the current trend and indicate the preferred trading direction.
The MACD (14,22,3) indicator, encompassing both the histogram and signal line, acts as an auxiliary tool and can also be used as a source of signals.
Important speeches and reports (always noted in the news calendar) can profoundly influence the price dynamics. Hence, trading during their release calls for heightened caution. It may be reasonable to exit the market to prevent abrupt price reversals against the prevailing trend.
Beginners should always remember that not every trade will yield profit. Establishing a clear strategy, coupled with effective money management, is key to long-term success in trading.