Analyzing Wednesday's trades:
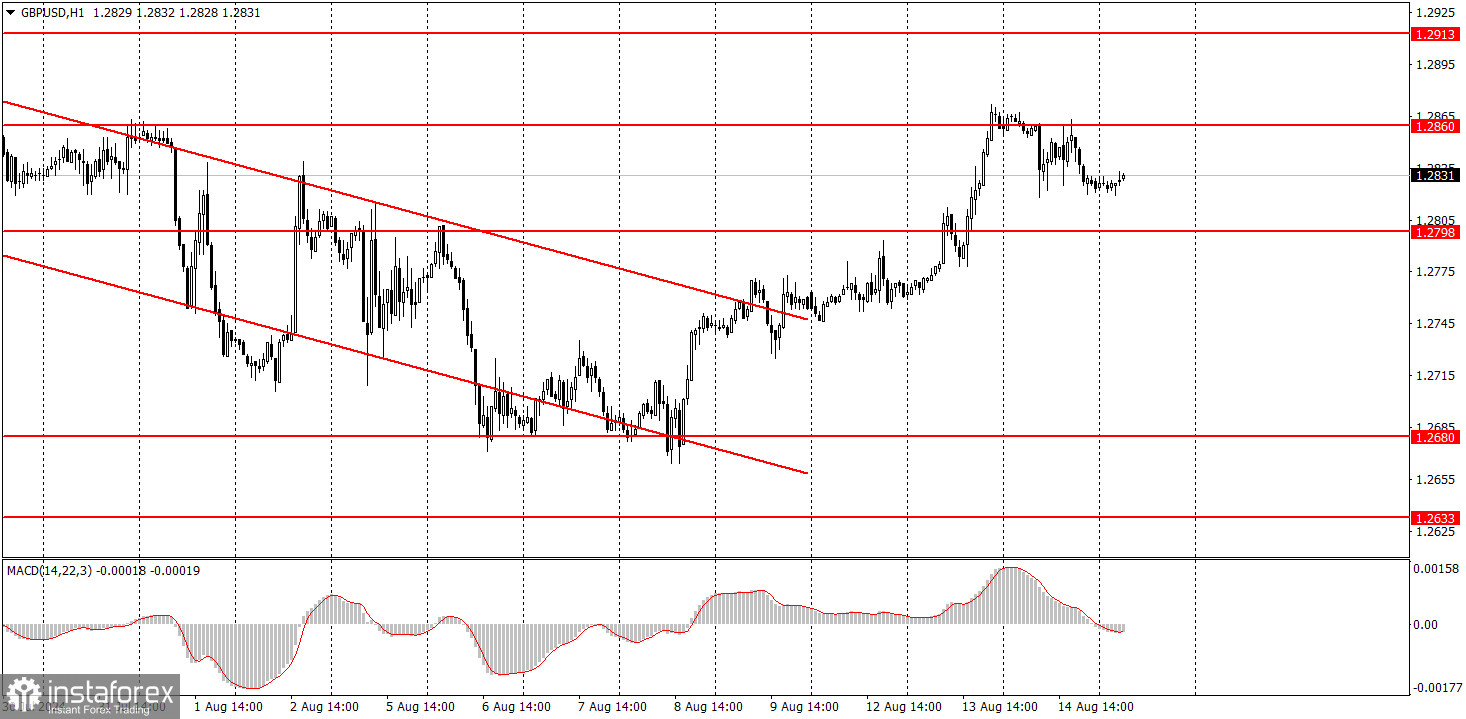
GBP/USD on 1H chart
The GBP/USD pair could not sustain its upward movement on Wednesday, which is somewhat surprising. The British pound usually seizes any opportunity to show growth. However, yesterday's inflation report in the UK came in below expectations. In other words, the Consumer Price Index increased, but less than the market had anticipated. As a result, the likelihood of a rate cut by the Bank of England at its next meeting slightly increased, which is unfavorable for the British currency. The U.S. inflation report was released in the afternoon, showing a slowdown from 3% to 2.9%. From our perspective, a 2.9% rate is not significantly different from 3%. Both figures do not give the Federal Reserve a reason to begin easing monetary policy. Nevertheless, the market once again rushed to sell the U.S. dollar and only narrowly avoided closing the price above 1.2860.
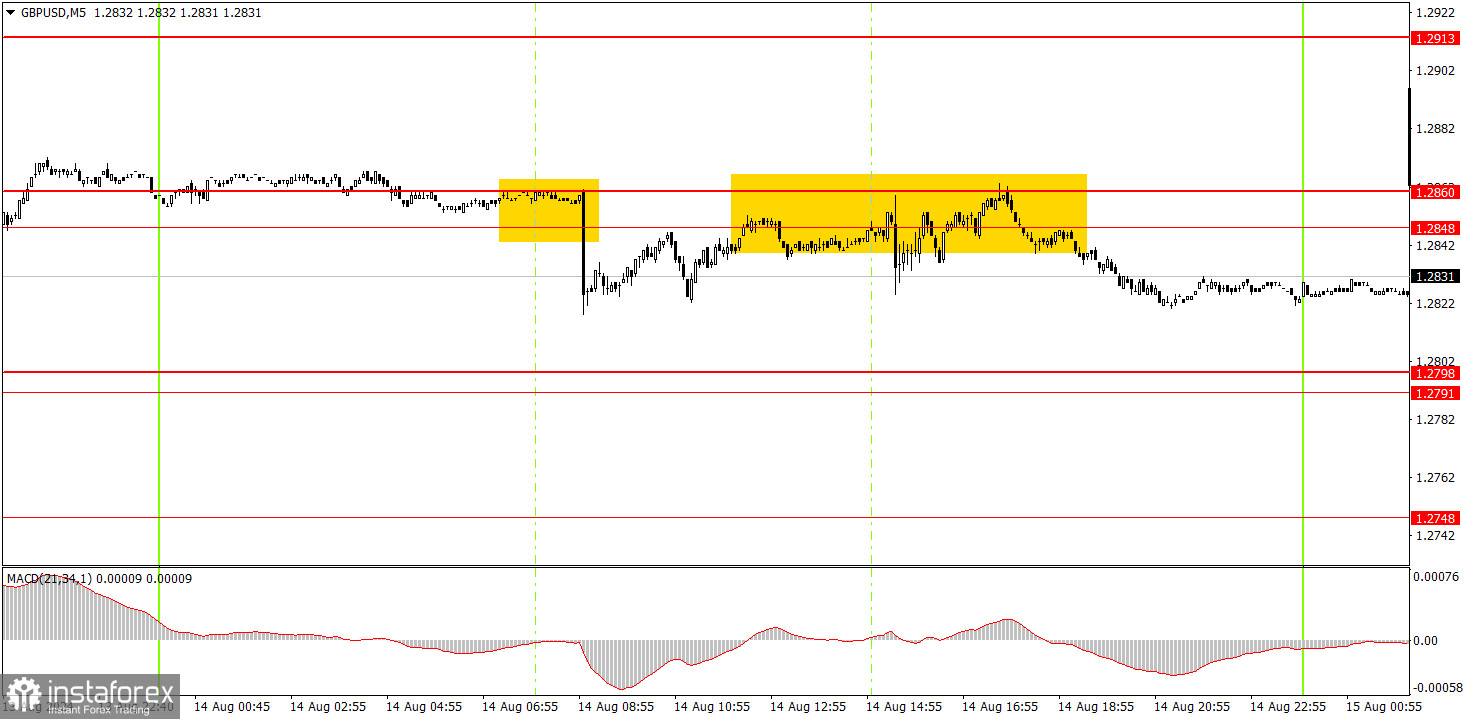
GBP/USD on 5M chart
In the 5-minute time frame, two sell signals were generated on Wednesday, but both were quite vague. The day's volatility was only 49 pips, and with such low volatility, expecting good signals and profit is unrealistic. The price bounced twice from the 1.2848-1.2860 area. The first bounce led to a five-minute drop in the pair, so there was no opportunity to enter the market based on that signal. The second signal was formed in the evening when it was time to leave the market rather than enter it.
Trading tips on Thursday:
In the hourly time frame, GBP/USD has a good chance of sustaining the downtrend but is going through an upward correction. The British pound is still overbought, while the dollar is undervalued, and the market continues to use every opportunity to buy the British currency. It simply ignores any unfavorable reports. Yesterday, one can expect a new dollar collapse, which miraculously did not happen.
On Thursday, novice traders can trade from the 1.2848-1.2860 or the 1.2791-1.2798 area. The macroeconomic background will be present in the UK and the U.S., so it is worth paying attention to.
The key levels to consider on the 5M timeframe are 1.2547, 1.2605-1.2633, 1.2684-1.2693, 1.2748, 1.2791-1.2798, 1.2848-1.2860, 1.2913, 1.2980-1.2993, 1.3043, 1.3102-1.3107, 1.3145. On Thursday, the UK will release GDP and industrial production reports, while the US will report on retail sales, industrial production, and unemployment claims. Although these reports are not the most crucial, there are five of them, so they could influence the GBP/USD pair's movement throughout the day.
Basic rules of a trading system:
1) The strength of a signal is determined by the time it took for the signal to form (bounce or level breakthrough). The shorter the time required, the stronger the signal.
2) If two or more trades around a certain level are initiated based on false signals, subsequent signals from that level should be ignored.
3) In a flat market, any currency pair can produce multiple false signals or none at all. In any case, it's better to stop trading at the first signs of a flat market.
4) Trades should be opened between the start of the European session and mid-way through the U.S. session. All trades must be closed manually after this period.
5) In the hourly time frame, trades based on MACD signals are only advisable amidst substantial volatility and an established trend, confirmed either by a trendline or trend channel.
6) If two levels are too close to each other (from 5 to 20 pips), they should be considered as a support or resistance zone.
7) After moving 15 pips in the intended direction, the Stop Loss should be set to break-even.
What's on the charts:
Support and Resistance price levels: targets when opening long or short positions. You can place Take Profit levels near them.
Red lines: channels or trend lines that depict the current trend and indicate the preferred trading direction.
The MACD (14,22,3) indicator, encompassing both the histogram and signal line, acts as an auxiliary tool and can also be used as a source of signals.
Important speeches and reports (always noted in the news calendar) can profoundly influence the price dynamics. Hence, trading during their release calls for heightened caution. It may be reasonable to exit the market to prevent abrupt price reversals against the prevailing trend.
Beginners should always remember that not every trade will yield profit. Establishing a clear strategy, coupled with effective money management, is key to long-term success in trading.