Analyzing Friday's trades:
GBP/USD on 1H chart
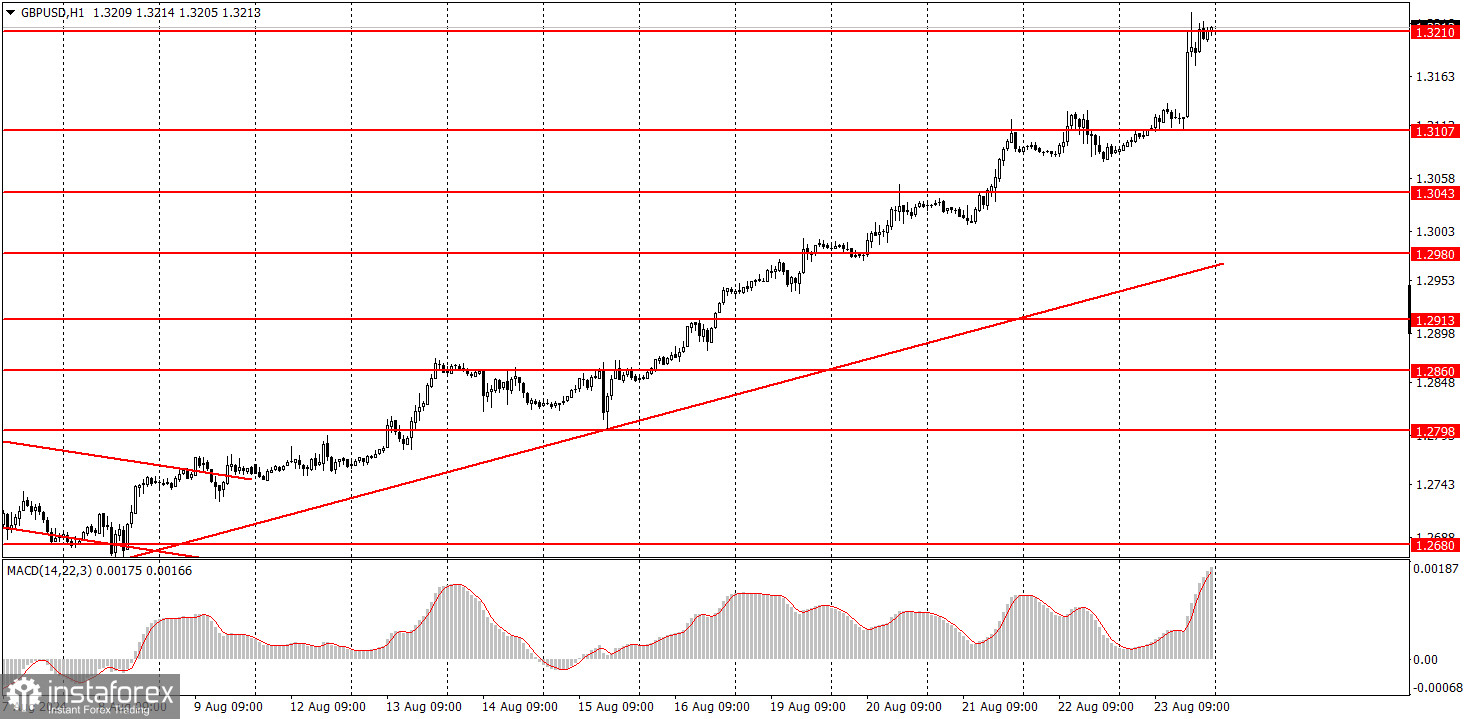
The GBP/USD pair continued its "flight to the moon" on Friday. Throughout the day, the U.S. dollar fell another 130 pips, doing so quickly, simply, and freely. The U.S. currency started to fall early in the morning despite the lack of macroeconomic or fundamental events in both the UK and the U.S. at that time. The market simply continued to sell off the dollar in anticipation of Federal Reserve Chair Jerome Powell's upcoming speech in Jackson Hole. We had expected the market to react preemptively to Powell's dovish rhetoric and that Friday would see a reversal. However, the market kept seizing any opportunity to buy the pair. It doesn't matter which factors have been addressed or whether there are any factors for the daily decline of the dollar. All of that is irrelevant. The upward movement is entirely illogical. Bank of England Governor Andrew Bailey's speech was of no interest from the start. The fact that the BoE is easing its monetary policy is even less relevant. Everything revolves around the dollar and the Fed's interest rate cuts in September.
GBP/USD on 5M chart
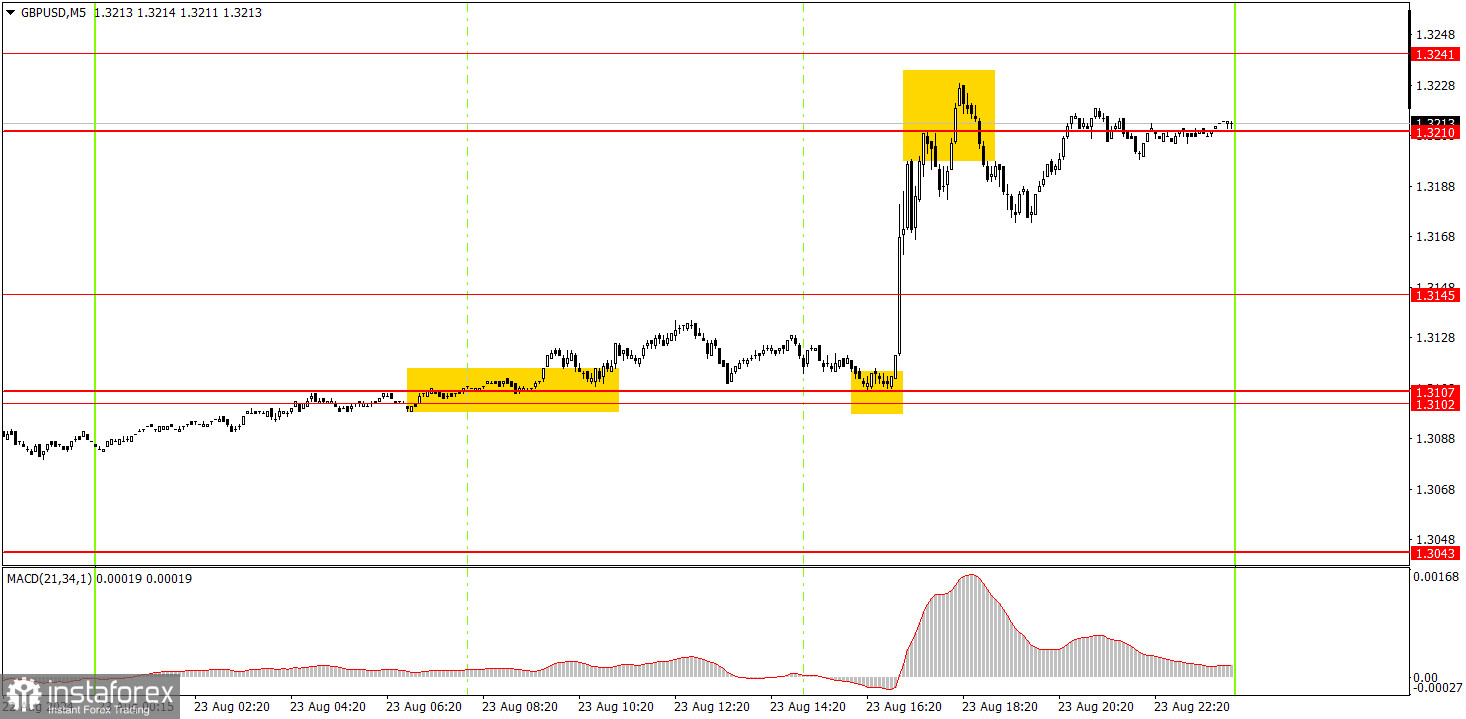
In the 5-minute time frame, two buy signals were formed around the 1.3102-1.3107 area on Friday. After the first buy signal was formed, the price failed to rise by 20 pips, so at the time the second signal was generated, novice traders could still be in the market. Since Powell's speech started around the same time, it would have been prudent to set a Stop Loss to break even or just below the 1.3102-1.3107 area, which justified the risks. Subsequently, the price surged to 1.3210, where profits could be realized.
How to trade on Monday:
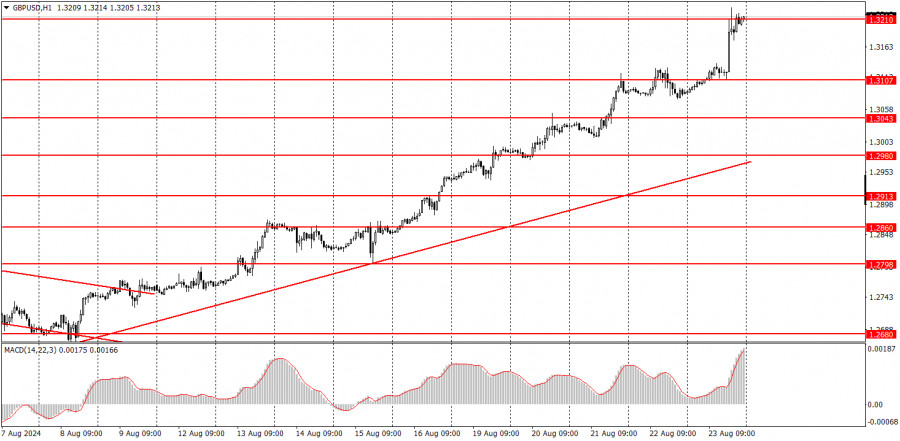
In the hourly time frame, GBP/USD has a good chance of sustaining the global downward trend, but a local uptrend is currently in progress. The British pound is still overbought, the dollar is undervalued, and the market continues to use every opportunity to buy the British currency and sell the dollar. It often ignores any unfavorable reports and events.
On Monday, the pair might retrace slightly downward, but the uptrend is unlikely to be disrupted. Trading can be done from the 1.3210 level, from which the price bounced twice on Friday.
The key levels to consider on the 5M timeframe are 1.2605-1.2633, 1.2684-1.2693, 1.2748, 1.2791-1.2798, 1.2848-1.2860, 1.2913, 1.2980-1.2993, 1.3043, 1.3102-1.3107, 1.3145, 1.3210. On Monday, while no significant events are scheduled in the UK, the release of the durable goods orders report in the U. S. could significantly influence market dynamics. Despite this, the market's relentless selling of the dollar should be kept in mind.
Basic rules of the trading system:
1) The strength of a signal is determined by the time it takes for the signal to form (bounce or level breakthrough). The less time it took, the stronger the signal.
2) If two or more trades around a certain level are initiated based on false signals, subsequent signals from that level should be ignored.
3) In a flat market, any currency pair can form multiple false signals or none at all. In any case, it's better to stop trading at the first signs of a flat market.
4) Trades should be opened between the start of the European session and midway through the U.S. session. After this period, all trades must be closed manually.
5) In the hourly time frame, trades based on MACD signals are only advisable amidst substantial volatility and an established trend confirmed by a trendline or trend channel.
6) If two levels are too close to each other (5 to 20 pips), they should be considered support or resistance.
7) After moving 20 pips in the intended direction, the Stop Loss should be set to break even.
What's on the charts:
Support and Resistance price levels: targets for opening long or short positions. You can place Take Profit levels near them.
Red lines: channels or trend lines that depict the current trend and indicate the preferred trading direction.
The MACD (14,22,3) indicator, encompassing both the histogram and signal line, acts as an auxiliary tool and can also be used as a source of signals.
Important speeches and reports (always noted in the news calendar) can profoundly influence the movement of a currency pair. Hence, trading during their release calls for heightened caution. It may be reasonable to exit the market to prevent abrupt price reversals against the prevailing trend.
Beginners should always remember that not every trade will yield profit. Developing a clear strategy and effective money management is key to success in trading over a long period.