गुरुवार के ट्रेडों का विश्लेषण:
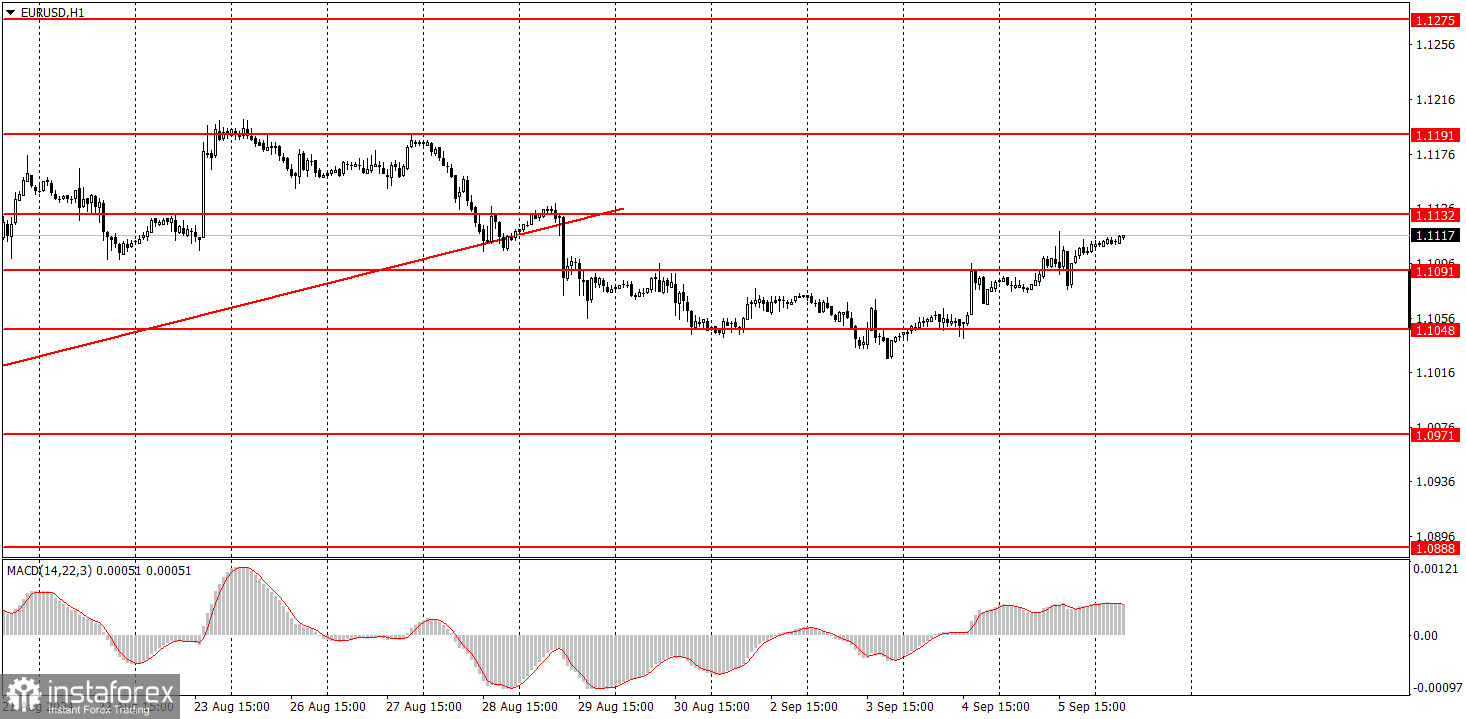
1H चार्ट पर EUR/USD
EUR/USD जोड़ी ने गुरुवार को अपनी ऊपर की ओर गति बनाए रखी। यह कमजोर, अनिश्चित और सुधारात्मक था, लेकिन जोड़ी बढ़ी। याद रखें कि 26 अगस्त के बाद की सभी गतिविधियों को एक कमजोर सुधार माना जाता है। इस प्रकार, वर्तमान ऊपर की ओर गति हाल के हफ्तों और महीनों के ऊपर की ओर प्रवृत्ति के एक नए चरण की शुरुआत की तरह दिखती है। इस सप्ताह, डॉलर को व्यापक आर्थिक पृष्ठभूमि से समर्थन की उम्मीद थी, लेकिन मंगलवार की शुरुआत में ही ये उम्मीदें फीकी पड़ने लगीं। सबसे पहले, ISM विनिर्माण व्यवसाय गतिविधि सूचकांक पर्याप्त अच्छा नहीं था, और फिर JOLTS रिपोर्ट पूर्वानुमानों से कमजोर थी। फिर, ADP श्रम बाजार रिपोर्ट ने पिछले 3.5 वर्षों का रिकॉर्ड निचला स्तर तय किया। इसलिए, डॉलर बढ़ने से खुश हो सकता है, लेकिन जब अमेरिका से केवल निराशाजनक डेटा आता है तो यह कैसे बढ़ सकता है? हमने उल्लेख किया कि अमेरिकी मुद्रा 18 सितंबर तक और उसके बाद एक या दो महीने तक स्वतंत्र रूप से गिर सकती है।
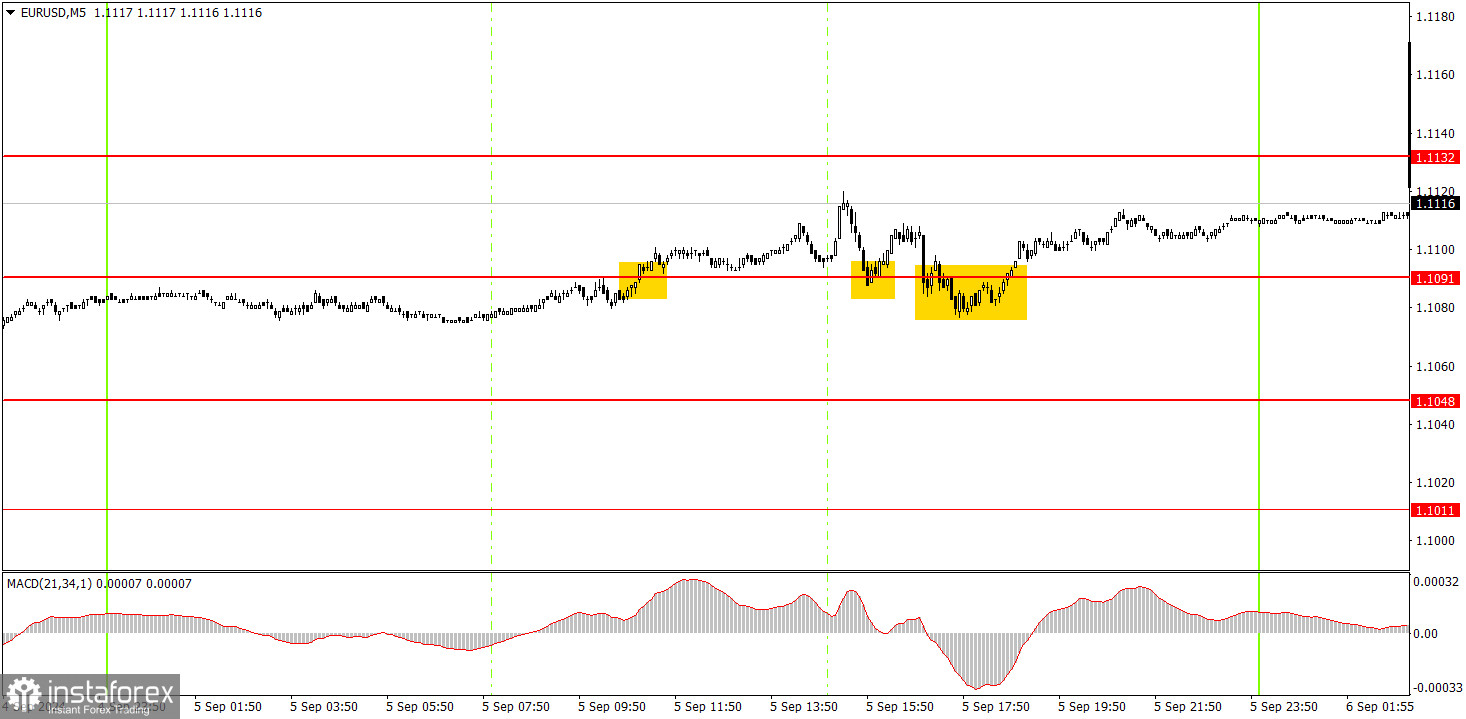
5M चार्ट पर EUR/USD
गुरुवार को 5 मिनट की समय-सीमा में कई व्यापारिक संकेत बने, लेकिन अस्थिरता कम रही। अमेरिकी व्यापार सत्र में एक विनाशकारी ADP रिपोर्ट और सकारात्मक ISM सेवा व्यवसाय गतिविधि सूचकांक देखा गया। यही कारण है कि डॉलर शुरू में गिरा, बढ़ा और फिर गिर गया। आज, किसी को अतिरिक्त सतर्क रहने की आवश्यकता है क्योंकि नॉनफार्म पेरोल और बेरोजगारी रिपोर्ट पर प्रतिक्रिया होगी। उलटफेर, झूठे संकेत और बढ़ी हुई अस्थिरता संभव है।4
शुक्रवार को व्यापार कैसे करें?:
प्रति घंटे की समय सीमा में, EUR/USD जोड़ी आरोही प्रवृत्ति रेखा के नीचे समेकित हो गई है और, लंबे समय में पहली बार, एक नीचे की ओर प्रवृत्ति बनाने का मौका है जो तार्किक और सभी कारकों और विश्लेषण के प्रकारों के अनुरूप होगी। दुर्भाग्य से, नीचे की ओर सुधार के बाद अतार्किक डॉलर की बिक्री जल्दी से फिर से शुरू हो सकती है, क्योंकि कोई नहीं जानता कि बाजार कब तक फेडरल रिजर्व की मौद्रिक नीति में ढील को जारी रखेगा, जो अभी शुरू होना बाकी है। हालांकि, तथ्य यह है कि बाजार भविष्य में फेड की दरों में लगभग सभी कटौती को महत्व देना जारी रखता है, और अमेरिका से मैक्रोइकॉनोमिक डेटा अक्सर खुश करने की बजाय निराश करते हैं।
शुक्रवार को, नौसिखिए व्यापारी किसी भी दिशा में और किसी भी मजबूती की चाल की उम्मीद कर सकते हैं। इस बात की कोई गारंटी नहीं है कि अमेरिकी डेटा विफल हो जाएगा, इसलिए डॉलर में वृद्धि भी संभव है।
5M समय सीमा पर विचार करने के लिए मुख्य स्तर 1.0726-1.0733, 1.0797-1.0804, 1.0838-1.0856, 1.0888-1.0896, 1.0940, 1.0971, 1.1011, 1.1048, 1.1091, 1.1132, 1.1191 और 1.1275-1.1292 हैं। शुक्रवार को, यूरोज़ोन तीसरे मूल्यांकन में दूसरी तिमाही के लिए जीडीपी पर एक रिपोर्ट जारी करेगा, और अमेरिका में, गैर-कृषि पेरोल और बेरोजगारी के स्तर पर प्रमुख रिपोर्ट प्रकाशित की जाएंगी।
ट्रेडिंग सिस्टम के बुनियादी नियम:
1) सिग्नल की ताकत सिग्नल बनने में लगने वाले समय (बाउंस या लेवल ब्रेकथ्रू) से निर्धारित होती है। जितना कम समय लगेगा, सिग्नल उतना ही मजबूत होगा।
2) यदि झूठे सिग्नल के कारण किसी भी स्तर के आसपास दो या अधिक ट्रेड खोले गए थे, तो उस स्तर से आने वाले बाद के सिग्नल को अनदेखा कर देना चाहिए।
3) एक फ्लैट मार्केट में, कोई भी मुद्रा जोड़ी कई झूठे सिग्नल बना सकती है या बिल्कुल भी नहीं बना सकती है। किसी भी मामले में, फ्लैट मार्केट के पहले संकेतों पर ट्रेडिंग बंद कर देना बेहतर है।
4) ट्रेड को यूरोपीय सत्र की शुरुआत और अमेरिकी सत्र के बीच में खोला जाना चाहिए। इस अवधि के बाद, सभी ट्रेड को मैन्युअल रूप से बंद किया जाना चाहिए।
5) प्रति घंटे की समय सीमा में, MACD सिग्नल पर आधारित ट्रेड केवल अच्छी अस्थिरता और ट्रेंडलाइन या ट्रेंड चैनल द्वारा पुष्टि की गई प्रवृत्ति के बीच ही उचित हैं।
6) यदि दो स्तर एक दूसरे के बहुत करीब हैं (5 से 20 पिप्स), तो उन्हें समर्थन या प्रतिरोध क्षेत्र माना जाना चाहिए।
7) इच्छित दिशा में 15 पिप्स आगे बढ़ने के बाद, स्टॉप लॉस को ब्रेक ईवन पर सेट किया जाना चाहिए।
चार्ट पर क्या है?:
समर्थन और प्रतिरोध मूल्य स्तर: लंबी या छोटी पोजीशन खोलने के लिए लक्ष्य। आप उनके आसपास टेक प्रॉफिट स्तर रख सकते हैं।
लाल रेखाएँ: चैनल या ट्रेंड लाइन जो वर्तमान ट्रेंड को दर्शाती हैं और पसंदीदा ट्रेडिंग दिशा को इंगित करती हैं।
MACD संकेतक (14,22,3): हिस्टोग्राम और सिग्नल लाइन दोनों को शामिल करते हुए, एक सहायक उपकरण के रूप में कार्य करता है और सिग्नल के स्रोत के रूप में भी इस्तेमाल किया जा सकता है।
महत्वपूर्ण भाषण और रिपोर्ट (हमेशा समाचार कैलेंडर में नोट किए जाते हैं) मुद्रा जोड़ी की चाल को गहराई से प्रभावित कर सकते हैं। इसलिए, उनके रिलीज़ के दौरान ट्रेडिंग करने के लिए अत्यधिक सावधानी बरतने की आवश्यकता होती है। मौजूदा चाल के विरुद्ध कीमतों में तेज उलटफेर से बचने के लिए बाजार से बाहर निकलना उचित हो सकता है।
शुरुआती लोगों के लिए, यह याद रखना महत्वपूर्ण है कि हर ट्रेड से लाभ नहीं मिलेगा। एक स्पष्ट रणनीति विकसित करना और प्रभावी धन प्रबंधन लंबी अवधि में ट्रेडिंग में सफलता की कुंजी है।