Analysis of GBP/USD 5M
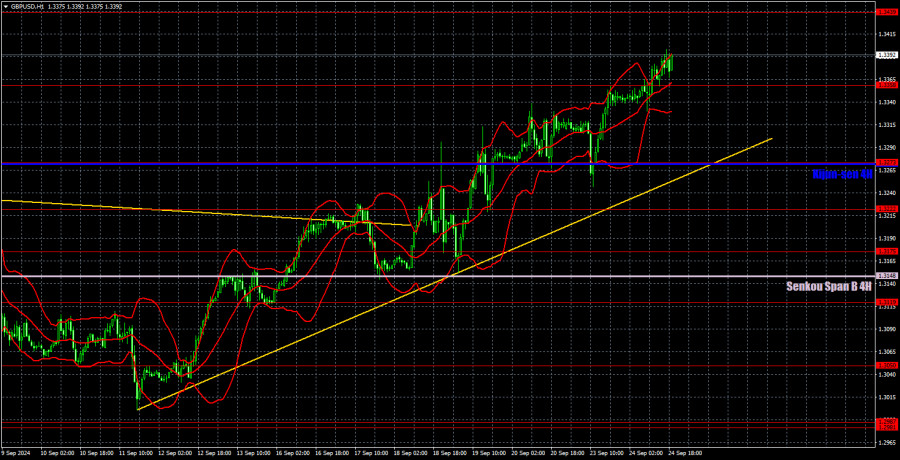
The GBP/USD pair rose again on Tuesday and updated its recent local high. If the British currency had no reason to grow on Monday because the UK data were weaker than expected, yesterday it had no reason either, as there was no data released in the US or the UK. Nevertheless, the British pound appreciated once more, almost as if responding to how justified the current upward movement is. From a technical standpoint, everything is natural. The price is positioned above the Ichimoku indicator lines and the trendline. Therefore, there are currently no signs of a decline. The price isn't even approaching any significant support lines, showing a complete lack of interest in any downward movement.
We've often mentioned that there are no fundamental or macroeconomic reasons for the pound to rise against the dollar. A year ago or at the start of this year, it could have been assumed that the market anticipated the future easing of the Federal Reserve's monetary policy. But now, the easing has already begun. We believe the upward momentum may continue for another month or so, but that's just a hypothesis. In any case, trading downward is hardly advisable until the price consolidates below the trendline.
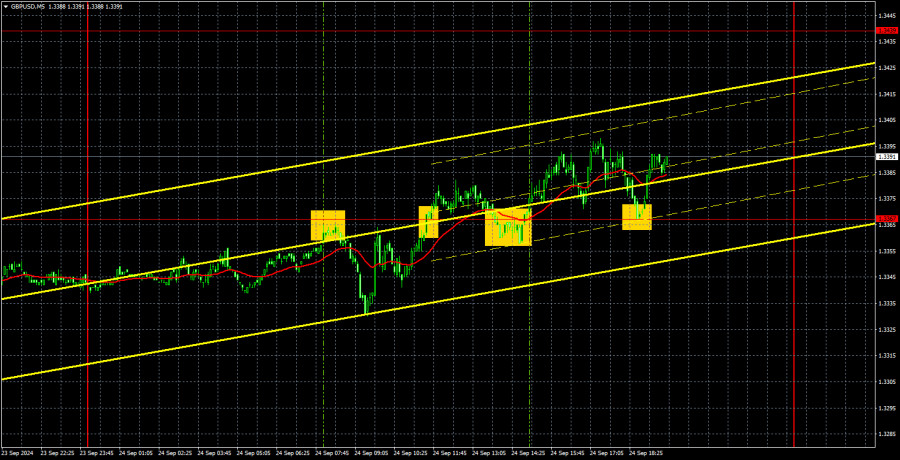
All trading signals from the past day were formed around the 1.3367 level. First, the pair bounced off this level and corrected downward by a "whopping" 25 pips. Then, it broke through this level and bounced off it twice more from above. Each time, it moved about 20 pips in the desired direction. As we can see, despite the constant rise in the hourly time frame, the movement on the lower charts is quite erratic. Nevertheless, traders could have earned several dozen pips in profit today.
COT report:
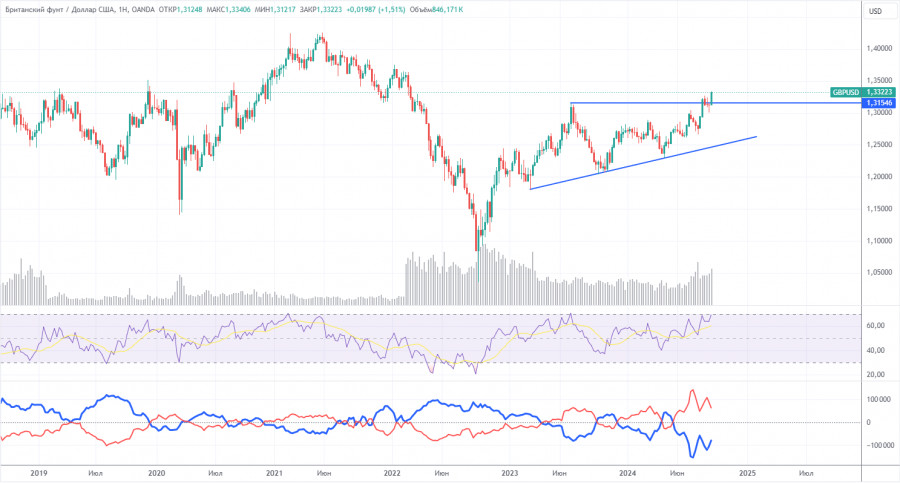
The COT reports for the British pound show that commercial traders' sentiment has been constantly changing in recent years. The red and blue lines, representing the net positions of commercial and non-commercial traders, intersect frequently and are often near the zero mark. We also see that the last downward trend occurred when the red line was below the zero mark. The red line is above 0, and the price has broken through the important level of 1.3154.
According to the latest report on the British pound, the non-commercial group closed 17,200 buy contracts and opened 10,000 sell contracts. Thus, the net position of non-commercial traders decreased by 27,200 contracts over the week. Yet, the pound sterling still appreciated.
The fundamental background still does not provide any grounds for long-term purchases of the pound sterling, and the currency has a real chance to resume the global downtrend. However, an ascending trend line formed in the weekly time frame, we have an ascending trend line, so until this line is broken, a long-term decline in the pound is unlikely. The pound sterling continues to rise against almost all odds, and even when COT reports show that large players are selling the pound, it still keeps climbing.
Analysis of GBP/USD 1H
In the hourly time frame, the GBP/USD pair has resumed and continues its upward movement, but we still cannot recommend buying the pound. The illogical upward trend of the British currency may persist for some time, even though the pair is again significantly overbought. On Monday, there were far more reasons for the pound to decline than to rise, yet we saw another move northward. Yesterday, there were no reasons at all. The pound has now grown as expected, regardless of any news—or lack thereof.
For September 25, we highlight the following important levels: 1.2796-1.2816, 1.2863, 1.2981-1.2987, 1.3050, 1.3119, 1.3175, 1.3222, 1.3273, 1.3367, and 1.3439. The Senkou Span B (1.3148) and Kijun-sen (1.3272) lines may also serve as signal sources. Setting the Stop Loss to break even when the price moves in the intended direction by 20 pips is recommended. The Ichimoku indicator lines may shift during the day, which should be considered when determining trading signals.
No significant events are scheduled for Wednesday in the UK or the US. We can expect low volatility, but the pound may continue to rise at a slower pace, even against an empty events calendar. We won't be surprised by this. Tuesday already proved it.
Explanation of Illustrations:
Support and resistance levels: Thick red lines near which the trend may end. They are not sources of trading signals.
Kijun-sen and Senkou Span B lines: These Ichimoku indicator lines, transferred from the 4-hour timeframe to the hourly chart, are strong lines.
Extreme levels: Thin red lines from which the price previously bounced. These provide trading signals.
Yellow lines: Trend lines, trend channels, and other technical patterns.
Indicator 1 on COT charts: The net position size for each category of traders.


