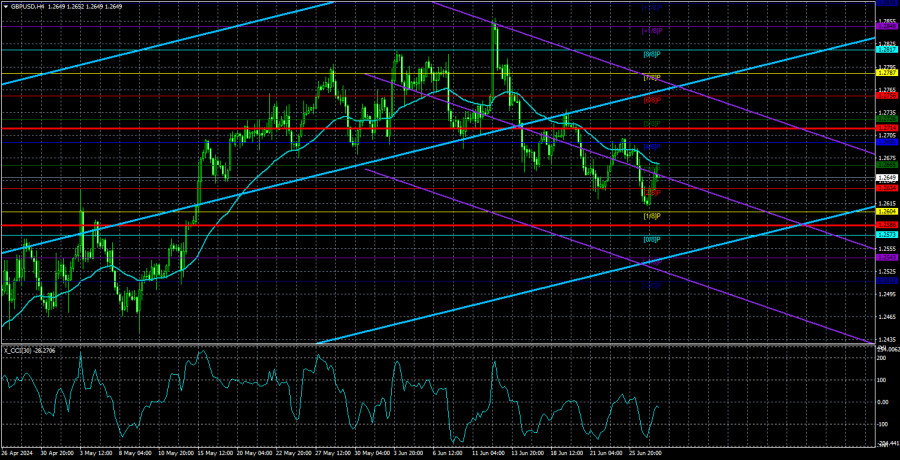
GBP/USD started a new upward movement on Thursday. As we can see, the decline has a wave-like character, like any movement in the forex market. There are movements that barely resemble textbook examples, and there are those that replicate textbook cases. Currently, we are dealing with the latter.
A global decline has been brewing for the pound for a very long time. For several months, we have been saying that the pound is extremely overbought, and major market players are probably manipulating its price. The fair value of the British currency is much lower than the current levels. The fundamental background for the pound does not promise anything good in the future. The macroeconomic background of the United Kingdom is no stronger than that of the United States. In addition, the global downward trend continues on the 24-hour timeframe, and if we look at the 4-hour chart, we see a reversal and a gradual decline. Everything points to a prolonged and strong decline.
However, as a reminder, what we just said is just a general picture of the market situation, not a trading recommendation to sell the pound now in anticipation of a 500-600 pip decline. In the near term, the pair can easily return to the 28th level, and only then will it start a new cycle of the global downtrend. Typically, movements in the forex market are much more complex than those shown in textbooks. Therefore, one must be prepared for any development. The most important thing is to understand what the movement should be in the long-term perspective, what the current trend is on higher timeframes. On the weekly and monthly timeframes, we have had a downward trend for 16 years. Even on the daily timeframe, it is downward, just not as obvious. Therefore, given the current circumstances, as well as considering all the problems of the British economy and upcoming changes in the monetary policy of the Bank of England and the Federal Reserve, we believe that the pound may continue to decline for several more months.
In regards to yesterday's events, the US GDP report exerted some pressure on the dollar, which isn't part of a trend. This was quite an illogical rise from the pair, but haven't we seen the same thing over the last six months? As we have analyzed in the EUR/USD article, the market could interpret this report in any way it liked. Most participants believed that GDP could and should have been higher than 1.4%. Today, the dollar could rise on purely technical grounds.
The same applies to today's GDP report from the UK. If the figure is above 0.6% for the quarter, the pound may continue to rise for some time. If below, it may resume its decline today. But globally, GDP reports do not affect anything. Thus, we consider it sensible to only consider short positions, and regard any moves above the moving average as simply corrections.
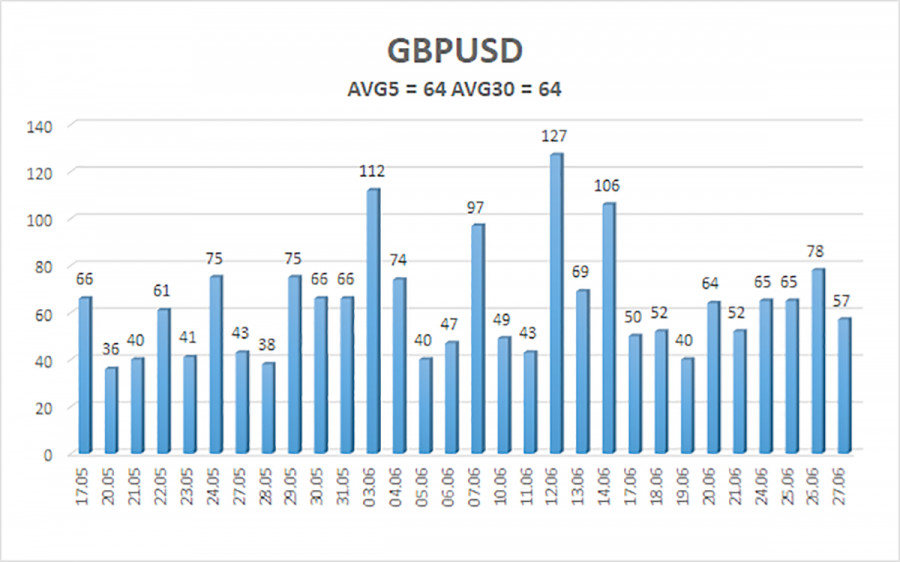
The average volatility of GBP/USD over the last five trading days is 64 pips. This is considered a "moderately low" value for the pair. Today, we expect GBP/USD to move within a range bounded by the levels of 1.2586 and 1.2714. The higher linear regression channel is pointing upwards, which suggests that the upward trend will continue. The CCI indicator entered the overbought and oversold areas recently.
Nearest support levels:
S1 - 1.2634
S2 - 1.2604
S3 - 1.2573
Nearest resistance levels:
R1 - 1.2665
R2 - 1.2695
R3 - 1.2726
Trading Recommendations:
The GBP/USD pair has once again consolidated below the moving average line and is trying to break the upward trend of the previous months. Therefore, after consolidating below the moving average line and overcoming the area of 1.2680-1.2695, the pound has better chances of falling further. However, traders should be cautious with any positions on the British currency. There is still no reason to buy it, and it is risky to sell, because the market ignored the fundamental and macroeconomic background for two months, and often simply refused to sell the pair. Nevertheless, only short positions can be considered relevant with targets of 1.2604 and 1.2586, if we are talking about a logical and natural movement.
Explanation of Illustrations:
- Linear Regression Channels – Helps determine the current trend. If both are directed in the same direction, it means the trend is currently strong.
- Moving Average Line (settings 20.0, smoothed) – Determines the short-term trend and the direction in which trading should currently be conducted.
- Murray Levels – Target levels for movements and corrections.
- Volatility Levels (red lines) – The probable price channel in which the pair will spend the next day, based on current volatility indicators.
- CCI Indicator – Its entry into the oversold area (below -250) or the overbought area (above +250) means that a trend reversal in the opposite direction is imminent.


