Analysis of EUR/USD 5M
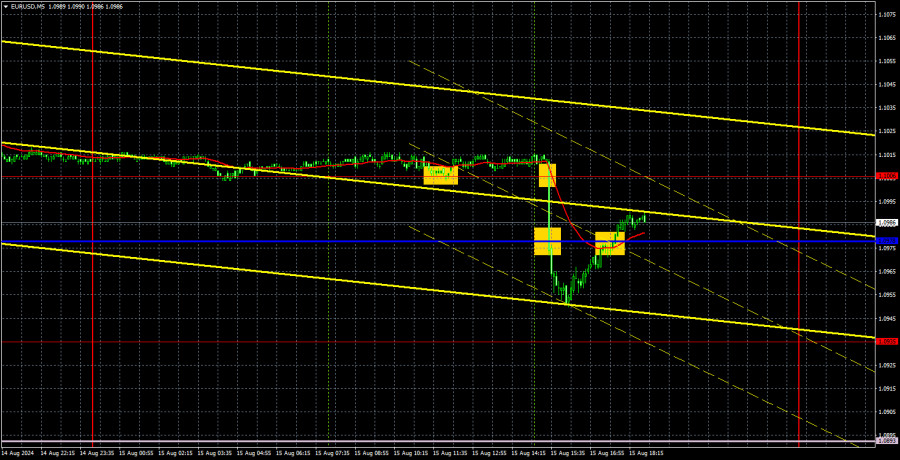
On Thursday, the EUR/USD pair remained stagnant during the first half of the day before plummeting downward and quickly recovering in the second half. When the price drops by 60 pips in just half an hour, it's clear that something triggered this movement. Checking the economic calendar, we see that reports on US retail sales and unemployment claims were released during the pair's decline. Both reports came in better than expected, which strengthened the dollar. The issue with the US currency is that this was a rapid and not particularly strong pullback. Yes, the pair fell by 60 pips, but what does that affect? The dollar continues to depreciate just as it did before.
This week, the latest dollar decline was triggered by much less impactful reports, such as the Producer Price Index (PPI) and the Consumer Price Index (CPI). Certainly, inflation is of much greater importance to the market than a routine retail sales report, but overall, the dollar has been falling with almost every US report. And when it does rise, it loses its advantage very quickly. Therefore, the market situation remains unchanged, with the uptrend continuing without question.
Four trading signals were generated on Thursday, and the first three were extremely difficult to execute. The first buy signal occurred in a completely flat market, the second and third signals would have been difficult to act on even for Batman, and by the time the fourth signal was formed, the movement had generally ended. We understand the desire of many traders to trade every day, but with such signals, it's hard to make significant progress. And indeed, it's challenging to earn profits.
COT report:
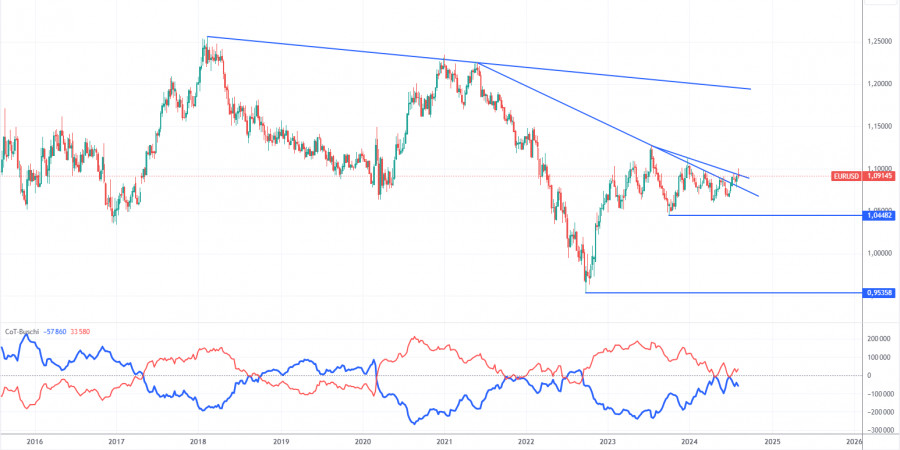
The latest COT report is dated August 6. The illustration above shows that the net position of non-commercial traders has been bullish for a long time and remains so. The bears' attempt to move into their zone of dominance failed miserably. The net position of non-commercial traders (red line) has declined in recent months, while that of commercial traders (blue line) has grown. Currently, they are approximately equal, indicating a new attempt by bears to seize control.
We also still do not see any fundamental factors supporting the strengthening of the euro, and technical analysis indicates that the price is in a consolidation phase—in other words, a flat. The general downtrend for the euro persists, but the market decided to take a break that lasted for seven months.
At the moment, the red and blue lines are slightly moving away from each other, which indicates that long positions on the single currency are increasing. However, given the flat conditions, such changes cannot be the basis for long-term conclusions. During the last reporting week, the number of long positions in the non-commercial group decreased by 2,700, while the number of short positions increased by 13,000. Accordingly, the net position decreased by 15,700. According to COT reports, the euro still has the potential for decline.
Analysis of EUR/USD 1H
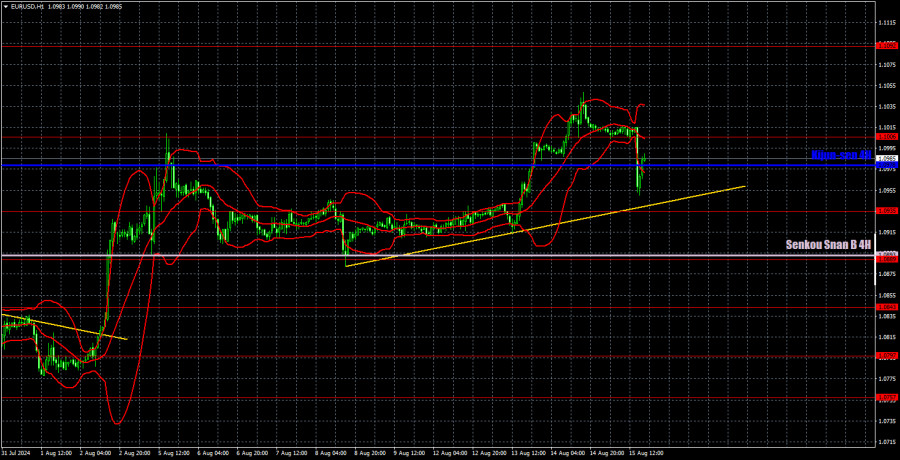
EUR/USD continues a gradual and measured upward movement in the hourly time frame. This week, new inflation reports from the US gave the market another reason to sell the dollar, and the market took full advantage of this opportunity. Now, we have an ascending trendline that supports the euro. Currently, none of the indicators suggest that the upward trend is ending.
For August 16, we highlight the following levels for trading: 1.0530, 1.0581, 1.0658-1.0669, 1.0757, 1.0797, 1.0843, 1.0889, 1.0935, 1.1006, 1.1092, as well as the Senkou Span B line (1.0893) and the Kijun-sen line (1.0978). The Ichimoku indicator lines can move during the day, so this should be considered when identifying trading signals. Remember to set a Stop Loss to break even if the price has moved in the intended direction by 15 pips. This will protect you against potential losses if the signal turns out to be false.
On Friday, no important reports are scheduled in the Eurozone, while in the US, reports on the number of approved building permits and consumer sentiment from the University of Michigan will be released. Both reports are considered "secondary of importance," so they are likely to provoke a significant reaction only if the actual values deviate considerably from the forecasts.
Explanation of illustrations:
Support and resistance levels: Thick red lines near which the trend may end.
Kijun-sen and Senkou Span B lines: These Ichimoku indicator lines, transferred from the 4-hour timeframe to the hourly chart, are strong lines.
Extreme levels: Thin red lines from which the price previously bounced. These provide trading signals.
Yellow lines: Trend lines, trend channels, and other technical patterns.
Indicator 1 on COT charts: The net position size for each category of traders


