empty
 
 
23.08.2024 10:21 AM
Learning and Analyzing: Trading Plan for Beginners EUR/USD and GBP/USD 23.08.24
Details from the Economic Calendar for August 22

Data on business activity indexes in the Eurozone, the UK, and the United States were published on Thursday. Nearly all indexes showed growth, but market attention was drawn to other events. The focus shifted to the news flow related to the beginning of the annual economic symposium in Jackson Hole, which traditionally influences monetary policy direction for the coming year. This year's central theme is "Reassessing the Effectiveness and Transmission of Monetary Policy."

This image is no longer relevant

Analysis of Trading Charts for August 22

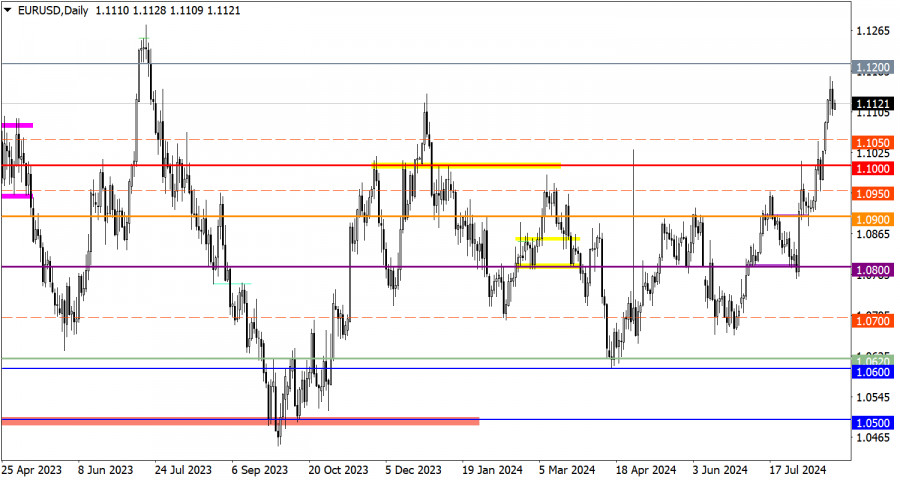
The EUR/USD pair experienced a slight pullback after breaking the local peak from December 2023. However, this movement does not disrupt the general upward trend.

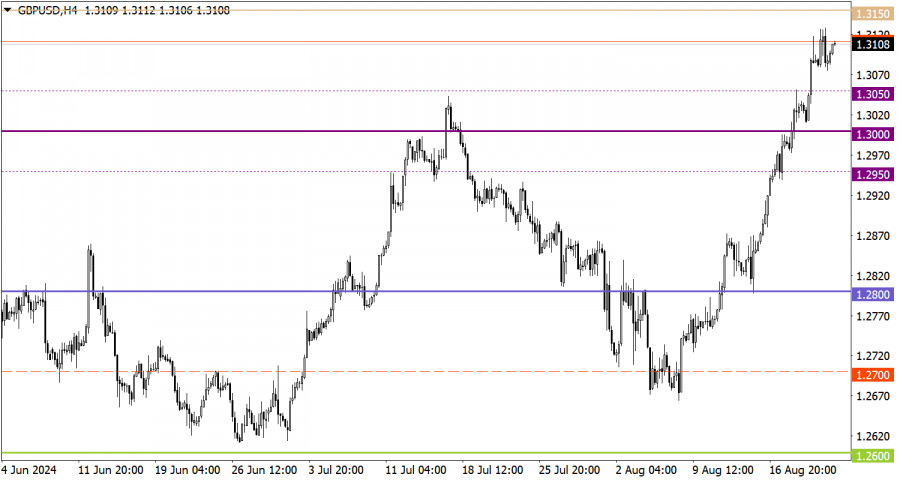
The GBP/USD pair also underwent a correction, but the extent was so minor that the price has almost fully recovered the volume of long positions.

The economic calendar for August 23 includes data on the US construction sector. However, the market's primary focus will be the Federal Reserve head's speech at the annual Jackson Hole symposium. Fed Chair Jerome Powell is expected to provide specific guidance regarding the central bank's upcoming actions, making this information critically important for traders.

This image is no longer relevant

Trading Plan – EUR/USD:

In the context of the current regrouping of trading forces after the correction, there are prospects for an increase in the volume of long positions in the euro. The quotes might aim for the peak of the current uptrend around 1.1280. In an alternative scenario, if the pullback continues, a return to the level of 1.1000 is possible.

Trading Plan – GBP/USD:

The British pound's uptrend will strengthen if the quote remains above 1.3150, which could lead to further appreciation. However, if this condition is not met, the risk of a correction to the 1.3000 level remains.

This image is no longer relevant

What is reflected on the trading charts?

Candlestick Chart: This chart type displays graphic rectangles in white and black with lines at the top and bottom. A detailed analysis of each candlestick reveals its characteristics relative to a specific period: opening price, closing price, highest price, and lowest price.

Horizontal Levels: These are price coordinates where the price might experience a halt or reversal. In the market, these levels are referred to as support and resistance.

Circles and Rectangles: These are highlighted examples where the price reversed in the past. The color highlighting indicates horizontal lines that may exert pressure on the quote in the future.

Up/Down Arrows: These are indicators of the potential future direction of the price.

Gven Podolsky,
Analytical expert of InstaForex
© 2007-2024
Earn on cryptocurrency rate changes with InstaForex
Download MetaTrader 4 and open your first trade
  • Grand Choice
    Contest by
    InstaForex
    InstaForex always strives to help you
    fulfill your biggest dreams.
    JOIN CONTEST
  • Chancy Deposit
    Deposit your account with $3,000 and get $1000 more!
    In August we raffle $1000 within the Chancy Deposit campaign!
    Get a chance to win by depositing $3,000 to a trading account. Having fulfilled this condition, you become a campaign participant.
    JOIN CONTEST
  • Trade Wise, Win Device
    Top up your account with at least $500, sign up for the contest, and get a chance to win mobile devices.
    JOIN CONTEST
  • 100% Bonus
    Your unique opportunity to get a 100% bonus on your deposit
    GET BONUS
  • 55% Bonus
    Apply for a 55% bonus on your every deposit
    GET BONUS
  • 30% Bonus
    Receive a 30% bonus every time you top up your account
    GET BONUS

Recommended Stories

Can't speak right now?
Ask your question in the chat.
Widget callback