Analysis of EUR/USD 5M
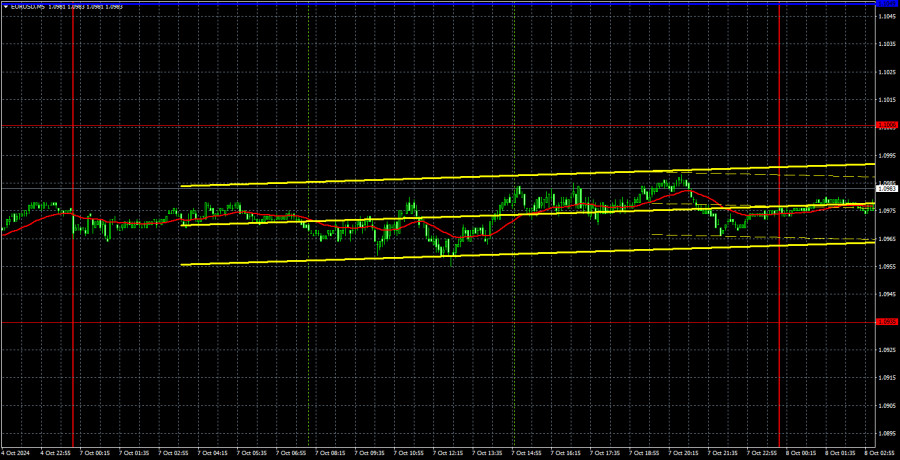
The EUR/USD currency pair was almost immobilized throughout Monday. We observed a total low-volatility flat market. Even the retail sales report from the Eurozone, which came in stronger than expected, did not help the euro recover even slightly after a week of decline. From this, we see, first of all, a positive signal and, secondly, an important fact. The signal is that the market is ready to continue moving downward. The dollar is so oversold and the euro so overbought that even positive macroeconomic data from the Eurozone cannot trigger a rise in the pair. In our opinion, this reflects the ultimate fairness.
Let's remember that the dollar has been falling for two years now, and it is difficult to answer why it has been declining for so long. The market was thoroughly preparing for the start of a monetary policy easing cycle. However, that cycle has already begun, so there is no reason for the dollar to continue falling, at least against the euro, whose European Central Bank is preparing to accelerate the monetary policy easing process. Therefore, a short-term upward correction is possible, with a U.S. inflation report ahead, but in the medium term, we still expect a decline down to price parity.
On Monday, there were no trading signals in the 5-minute time frame. The price didn't even come close to the levels of 1.1006 and 1.0935 during the day, so there were no grounds for opening trades.
COT Report:
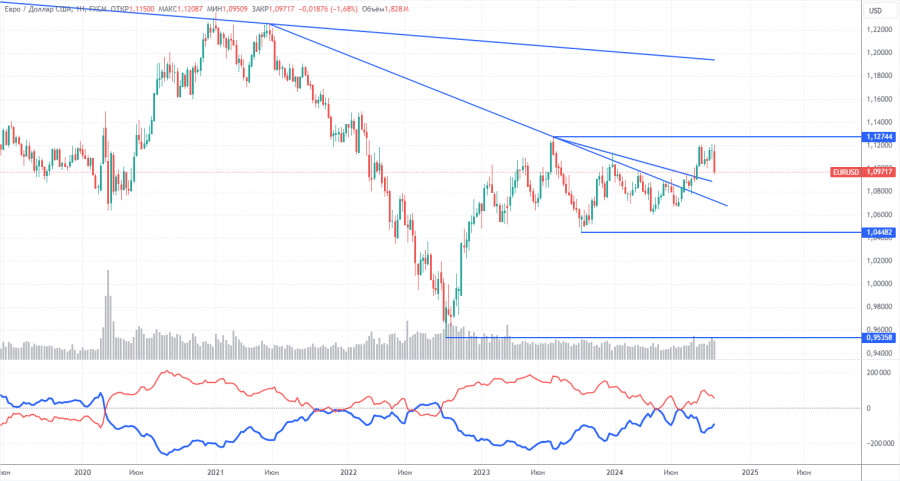
The latest COT report is dated October 1. The illustration above clearly shows that the net position of non-commercial traders has remained bullish for a long time. The bears' attempt to gain dominance failed miserably. The net position of non-commercial traders (red line) decreased in the second half of 2023 and the first half of 2024, while the position of commercial traders (blue line) increased. Currently, professional players are once again increasing their long positions.
We still do not see any fundamental factors supporting the strengthening of the euro, and technical analysis indicates that the price is in a consolidation zone – simply put, a flat market. On the weekly time frame, it's visible that since December 2022, the pair has been trading between 1.0448 and 1.1274. In other words, we have moved from a seven-month to an 18-month flat.
The red and blue lines are diverging, indicating an increase in long positions on the euro. However, such changes cannot serve as a basis for long-term conclusions within a flat market. During the last reporting week, the number of long positions in the non-commercial group decreased by 9,500, while the number of short positions increased by 6,800. Accordingly, the net position decreased by 16,300. The potential for a decline in the euro remains quite significant.
Analysis of EUR/USD 1H
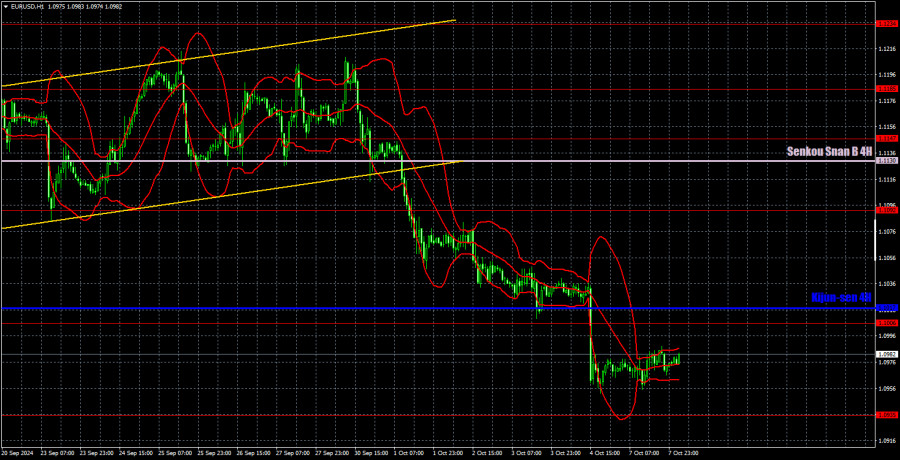
In the hourly time frame, the pair still has real chances to end the unjustified uptrend that has been ongoing for two years. There's no point in discussing the fundamental or macroeconomic reasons for a possible new dollar decline – they don't exist. Technical analysis has also turned in favor of the downward direction. Of course, the two-year uptrend may continue for some time due to momentum, but we expect nothing but a decline in the medium term.
For October 8, we highlight the following levels for trading: 1.0658-1.0669, 1.0757, 1.0797, 1.0843, 1.0889, 1.0935, 1.1006, 1.1092, 1.1147, 1.1185, 1.1234, 1.1274, as well as the Senkou Span B line (1.1130) and the Kijun-sen line (1.1017). The Ichimoku indicator lines may shift during the day, which should be considered when determining trading signals. Remember to set the Stop Loss order to break even if the price moves 15 pips in the intended direction. This will protect against potential losses if the signal turns out to be false.
There are no significant events or reports scheduled in either the Eurozone or the US on Tuesday. Thus, the flat market may persist, but the pair may still be inclined toward an upward correction for technical reasons.
Explanation of Illustrations:
Support and resistance levels: thick red lines where price movement may end. They are not sources of trading signals.
Kijun-sen and Senkou Span B lines: lines of the Ichimoku indicator transferred to the hourly time frame from the 4-hour chart. These are strong lines.
Extreme levels: thin red lines from which the price has previously bounced. They serve as sources of trading signals.
Yellow lines: trend lines, trend channels, and other technical patterns.
Indicator 1 on the COT charts: shows the net position size of each trader category.


