EUR/USD 5-Minute Analysis
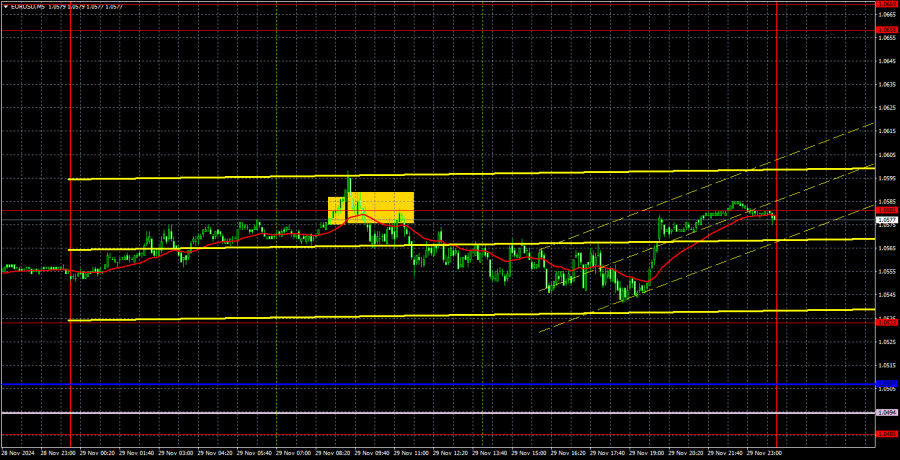
The EUR/USD pair traded with very low volatility for the second consecutive day on Friday. There were no significant movements on Thursday or Friday, and the direction remained more sideways than either bullish or bearish. Interestingly, Friday featured the week's most important report—Eurozone inflation—but its impact was muted, as evident from the market's reaction. The Consumer Price Index rose to 2.3%, as expected, while the core CPI remained at 2.7%, contrary to expectations of a rise of 2.8%. Inflation turned out slightly below market expectations.
This suggests that the European Central Bank could, in theory, lower the key interest rate slightly faster. However, as mentioned previously, this is currently irrelevant. First, the ECB is already cutting rates faster than other central banks. Second, it may reduce rates by 0.5% in December, making any "slight acceleration" negligible. Third, there was no deviation in headline inflation. Thus, we anticipated no significant market reaction to these inflation figures, which was confirmed.
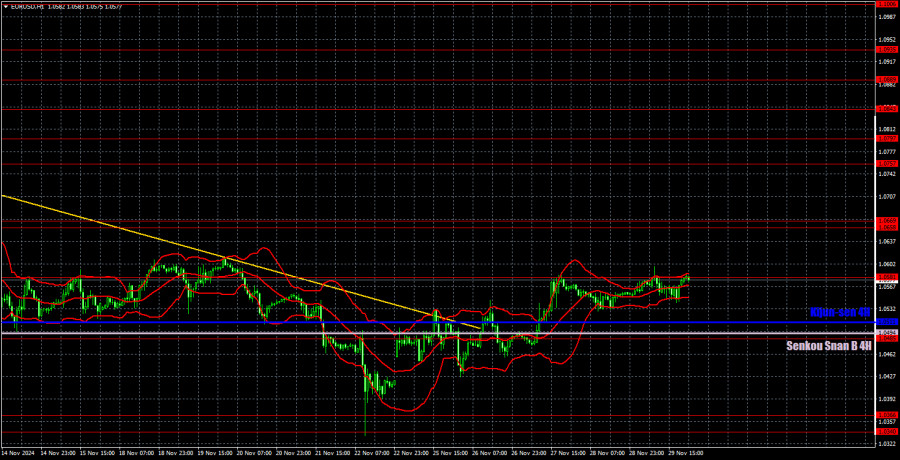
The correction continues, but whether it will persist this week depends on macroeconomic data from the US. Technically, the downtrend on the hourly timeframe has been broken, so further growth is possible. However, a correction can end at any moment.
Only one trading signal was generated on Friday, but it was exceptionally imprecise. Given the low volatility and the upcoming EU inflation data, taking risks was not advisable.
COT Report
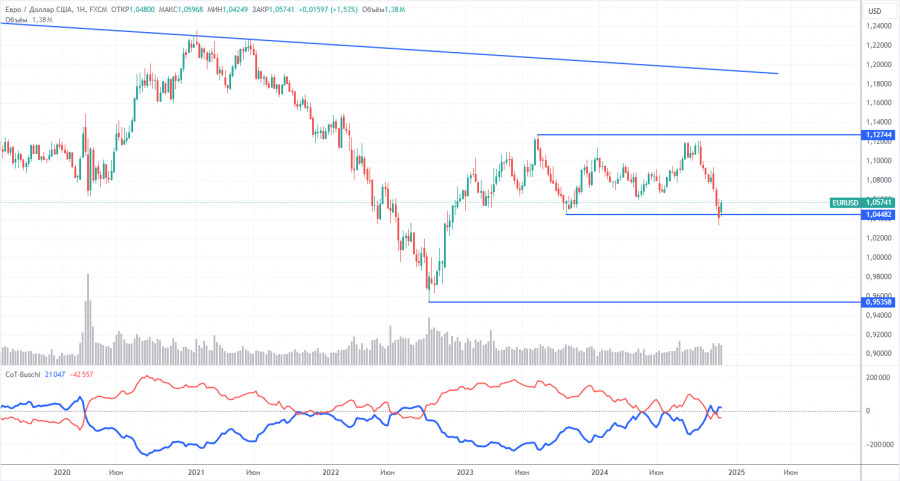
The latest Commitments of Traders (COT) report is dated November 19. The data clearly shows that the net position of non-commercial traders has been bullish for a long time, but the bearish sentiment is gradually gaining strength. A month ago, the number of short positions among professional traders surged, and for the first time in a long time, the net position turned negative. This indicates that the euro is now being sold more frequently than bought.
We continue to see no fundamental factors supporting euro strengthening, and technical analysis points to consolidation—a flat movement. On the weekly timeframe, the pair has been trading between 1.0448 and 1.1274 since December 2022. Thus, further decline remains likely. A break below 1.0448 would open up new space for a downward move.
The red and blue lines have crossed and changed their relative positions. During the last reporting week, the number of long positions in the non-commercial group fell by 5,700, while short positions rose by 29,400, leading to a net position decrease of 35,100.
EUR/USD 1-Hour Analysis
On the hourly timeframe, the pair consolidated above the downtrend line and started a correction. This correction could be slow and complex or quick and fleeting. This week's macroeconomic backdrop from the US will influence the market's corrective sentiment. We still believe there are no strong reasons for a significant euro rally, so we expect the correction to end and the pair to resume its decline toward parity.
For December 2, we highlight the following levels for trading - 1.0269, 1.0340-1.0366, 1.0485, 1.0581, 1.0658-1.0669, 1.0757, 1.0797, 1.0843, 1.0889, 1.0935, as well as the Senkou Span B (1.0494) and Kijun-sen (1.0511) lines. The lines of the Ichimoku indicator can move during the day, which should be considered when determining trading signals. Remember to place a Stop Loss order at breakeven if the price moves 15 pips in your favor. This will protect you from possible losses if the signal is false.
On Monday, we will note Christine Lagarde's speech and the ISM index of business activity in the US manufacturing sector. And we consider the ISM index even more significant than the speech of Lagarde, who spoke 5 times in the last two weeks.
Illustration Explanations:
- Support and Resistance Levels (thick red lines): Key areas where price movement might stall. Not sources of trading signals.
- Kijun-sen and Senkou Span B Lines: Ichimoku indicator lines transferred from the H4 timeframe to the hourly chart, serving as strong levels.
- Extreme Levels (thin red lines): Points where the price has previously rebounded. They can serve as trading signal sources.
- Yellow Lines: Trendlines, channels, or other technical patterns.
- Indicator 1 on COT Charts: Reflects the net position size of each trader category.


