


Additional tools are not always required to analyze the market. Oftentimes, you can find all the necessary information right on the price chart.
Charts can illustrate patterns that either signal a trend continuation or a potential reversal.
In this article, you will get an insight into such patterns and find out about their types as well as their advantages and disadvantages.
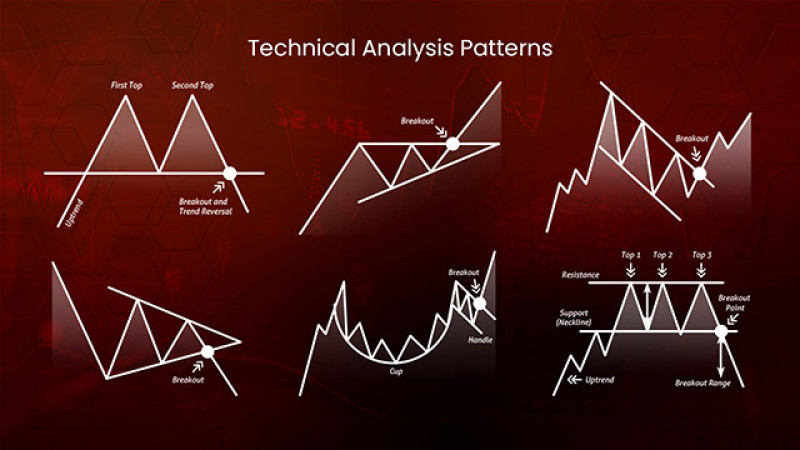
Technical analysis patterns
The market is believed to move in cycles, which means trends can repeat from time to time.
This assumption allows us to forecast developments in the market based on historical data.
This is what technical analysis is meant for. Using special tools, traders analyze past quotes to foresee future movements.
Fundamental analysis helps understand whether it is worth investing in a particular asset. Meanwhile, technical analysis can signal when it is the right time for trading.
Therefore, there is sometimes no point in using additional tools such as technical indicators to forecast developments in the market.
The price chart itself is a mine of information. The most important here is to know how to read and use it to get the most out of it.
Let’s see what data the price chart can show traders. It is important to understand that once a trade is opened, it gets instantly reflected on the price chart.
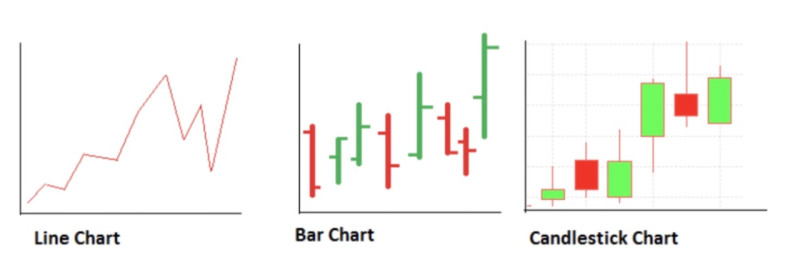
There are several types of a chart. They can be illustrated as a line, bars, or candlesticks. The line chart is the simplest one.
The bar chart is more complex. Bars show the highest and lowest prices and have different colors.
When it is the candlestick chart, each candle consists of a real body and shadows. The real body reveals the highest and lowest points, and shadows indicated the open and close prices.
Candlesticks can also have different colors, where lighter color means that the close price is above the open price, whereas a darker color reflects the opposite situation.
At the same time, the price may either rise (bullish trend) or fall (bearish trend).
When the movement cannot be clearly identified, the price is said to be in a sideways trend or flat.
Numerous factors from breaking news to the activity of major players in the market can influence the price at any moment.
Technical analysis helps foresee possible reversals.
All technical analysis patterns
In order to find entry and exit points, it is essential to forecast trend continuations and reversals.
Using technical indicators is one of the ways to do this. Many of them are built into trading platforms and can be added to the chart with just one click.
However, applying them requires a deeper understanding of how they work and how to interpret their signals, which can be challenging, especially for novice traders.
In addition, indicators generate signals by analyzing the price chart. So, their signals may come with a delay. In other words, traders may receive incorrect information and untimely signals.
A solution would be to use several indicators at once so that they can confirm and filter each other's signals.
However, this approach can only make the life of a trader harder, as tracking signals from several indicators can be confusing.
Therefore, many traders prefer analyzing the price chart instead. The thing is that price movements frequently form certain patterns on the chart.
All patterns are divided into two large groups:
- Continuation patterns
- Reversal patterns
Let’s take a closer look at them now.
Continuation patterns
The first group is patterns that signal the continuation of a trend. In this case, traders should hold their positions open or add new ones to maximize profits.

Continuation patterns include:
- Flag
- Pennant
- Wedge
- Rectangle
The Pennant is considered to be one of the most reliable patterns. It emerges on the chart after an unexpected increase/decrease in the price.
This pattern resembles a horizontal triangle with a so-called flagpole, which is formed by several impulse candlesticks preceding the Pennant.
At the same time, price fluctuations within the triangle gradually decrease. The narrowing of the range indicates that some players are leaving the market for one reason or another.
The Pennant looks almost the same in both an uptrend and a downtrend. However, in case of an uptrend, the line breaks through the upper limit of the Pennant and goes further up.
During a downtrend, the Pennant looks inverted with its flagpole above the triangle. The line breaks through the lower limit of the Pennant and extends the fall.
This pattern is believed to form on the chart faster than any other as well as to have a stronger inner dynamic. The pattern confirms that the trend has already gained momentum and will continue to accelerate.
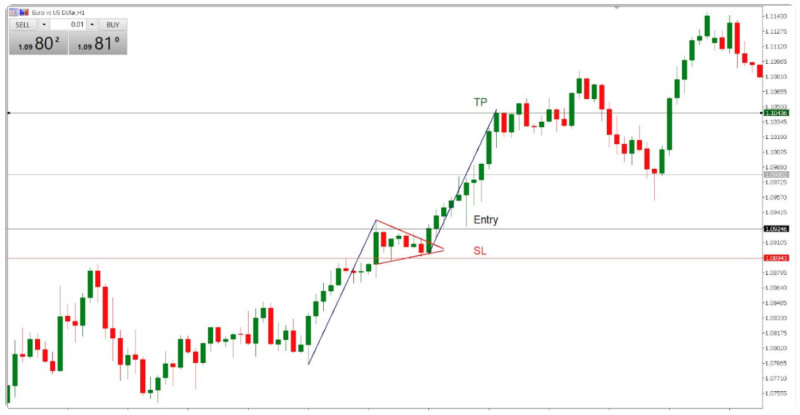
When the Pennant pattern is formed, trades should be opened in the direction of the trend that preceded its formation. An asset can be bought when it is the uptrend that preceded the pattern, whereas sell trades should be opened when it is the downtrend.
How to use Flag patterns efficiently
Let’s now consider other patterns in this group.
When the Flag pattern occurs, trading continues with the current trend. Moreover, when it comes to this formation, you can open trades even in the middle of a trend.
This pattern is formed when the price moves with the trend and then suddenly stops. At moments like that, the market briefly starts trading sideways.
The price moves within the limits of the Flag that run parallel to each other and are angled in the direction of the general trend. Fluctuations within the channel are insignificant.
When 3-4 waves can form within the pennant, there can be up to 7 waves in the Flag pattern.
When moving up, the price breaks through the upper limit of the corridor from bottom to top. Conversely, when moving down, it breaks through the lower limit from top to bottom
In case of an uptrend, buy trades should be opened when the candlestick that breaks through the upper limit of the corridor closes.
The Rectangle pattern is similar to the Flag. It emerges when the price starts fluctuating within a fairly narrow horizontal range.
When the price no longer moves with the current trend and cannot reverse either, it means that the current trend is highly likely to continue.
The narrower the Rectangle, the stronger the breakout through one of the channel’s limits.
You can not only drink but trade from a cup
A Cup and Handle is a less-popular and more complex pattern.
Interestingly, it forms only under certain circumstances. Firstly, the price should be in an uptrend, which continues when the pattern is built up completely.
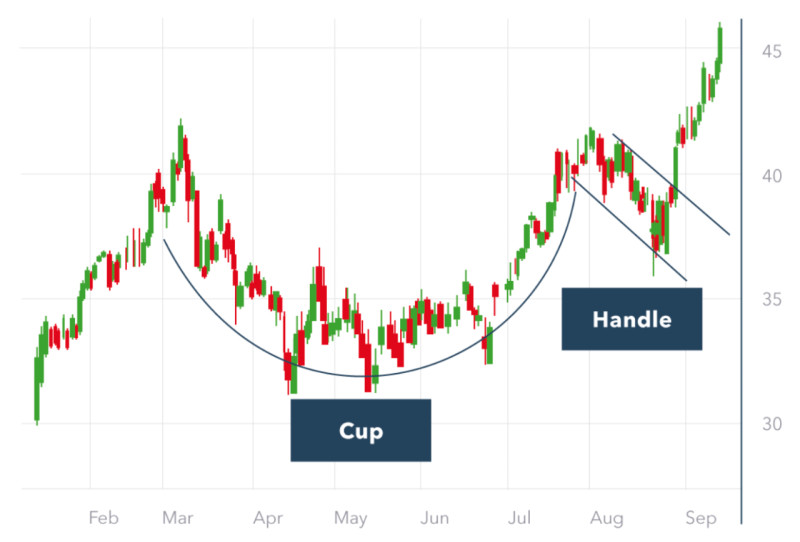
The price goes up but stops when a certain level is reached and then starts falling. This is the moment when the formation of the Cup’s bottom begins, with the price gradually decreasing.
Once the price goes down, it is time to draw the resistance line through the reversal point. This will also be a reference point when you open trades.
The price then starts gradually rising, and the entire Cup is already formed. Meanwhile, the Handle illustrates a brief corrective period.
At the same time, the edges of the Cup and Handle are approximately at the same level. The price should never cross the resistance level.
When the pattern is fully built, the price starts growing again. This time, it crosses the resistance line, which is a signal to open a buy trade.
Volume indicators should be used together with this pattern to confirm the signal. They should move down or up together with the price.
When the Handle is formed on the chart, volume indicators should go down and then soar.
It can take the pattern up to six months to build up. Therefore, it should be used when trading in higher time frames. The higher the time frame, the more reliable the signal.
Bilateral patterns
Some patterns that appear on the chart may indicate both the continuation of the current trend and its reversal. The Wedge pattern is one of them.
It resembles a triangle with its lines heading towards each other. Both limits of the Wedge go in the same direction, unlike of the Pennant.
To build the pattern, the chart should touch the limits of the Wedge at least two – ideally three – times.
The formation is quite common on the price chart and can be of two types: bullish and bearish.
In both cases, this pattern is built in a similar way, but taking into account the directions of the Wedge and the current trend.
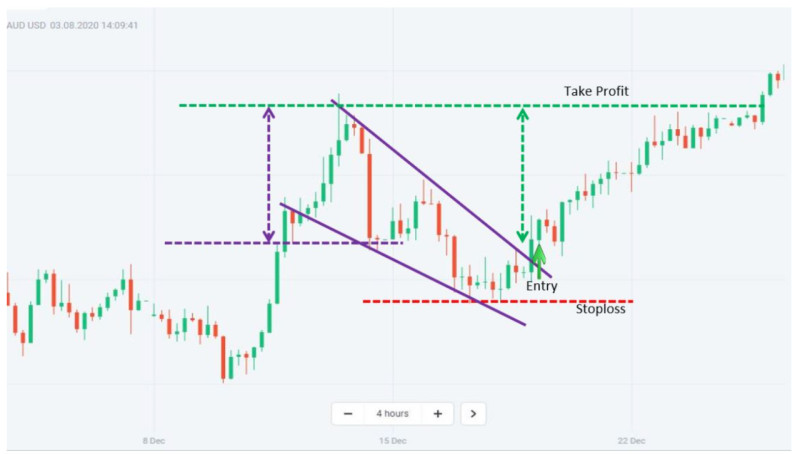
The Bearish Wedge during an uptrend signals its continuation, whereas a Bullish Wedge formed at the end of an uptrend indicates an impending reversal.
Conversely, a downtrend is set to continue when there is the Bullish Wedge and is about to reverse when it is the Bearish Wedge.
A trade should be opened when the price breaks through one of the limits of the pattern. Moreover, it is important to take into account the possibility of a continuation or a reversal.
For exchange-traded assets, traders look for such patterns in time frames higher than H1.
Reversal patterns in technical analysis
Patterns signaling a reversal belong to the second group. When a trend is about to reverse, traders close current positions and open new ones depending on the new trend.
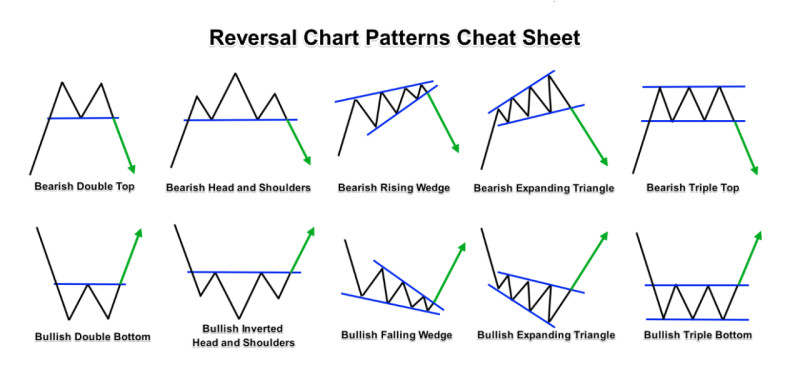
- Reversal patterns include:
- Double Top
- Double Bottom
- Diamond
- Head and Shoulders, etc.
The Double Top formation appears when a bearish reversal occurs, and the price twice attempts to go higher but pulls back and extends the fall.
Once the price hits the second top and then starts to slide, it is a signal to sell an asset.
Conservative traders prefer to wait for the moment the price reaches the bottom of the pattern to open trades. However, this approach can be considered unwise if the bottom is located deep enough.
There is another way to trade an asset with this pattern. After a breakout through the low from top to bottom, positions could be opened after the price returns to the low and touches it already from bottom to top.
Such patterns form regularly on the chart but are not always clearly identifiable.
In order to confirm signals that come from this formation, you can use volume indicators. As a rule, when the first top of the pattern emerges, volumes rise along with the price.
However, when the second top appears, the price grows but volumes decrease. This is a signal that a reversal is about to take place and the price starts falling.
All you need to know about Double Bottom
The Double Bottom is similar to the Doble Top but forms in the opposite direction. It occurs when there is a bullish reversal.
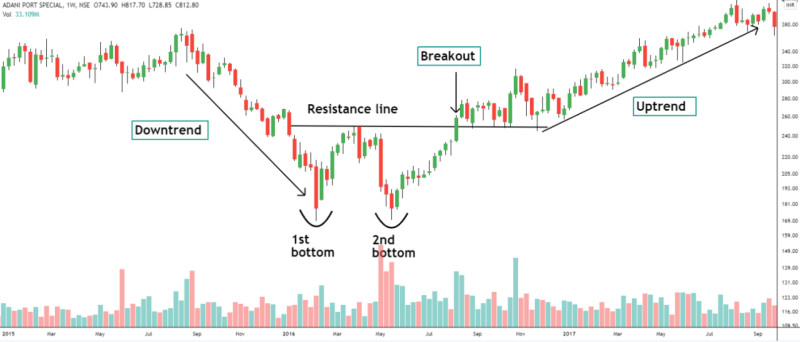
This pattern consists of two bottoms at the same level and one insignificant top. It resembles the letter “W” in its shape.
The first bottom is the swing low. Its formation is meaningless in itself. The support line can be plotted at this level.
A rise that follows should not exceed 10-20% of the first bottom. This is where a resistance line is drawn.
When the price reaches the second bottom, volumes also decrease. Once there is a bottom of the pattern, the price goes up and volumes rise.
Therefore, an asset can be bought when the pattern has two bottoms.
Conservative traders wait for the moment the price reaches the top of the pattern, which is located between the two bottoms to open trades.
This pattern is believed to build up for about a month. If it appears on the chart faster, it will most likely be a false one.
The Double Top and the Double Bottom apply to both lower and higher time frames. Therefore, they are suitable for short-term and medium-term trading.
Still, they have one big disadvantage, these formations do not predict how long the new trend they signal will last. That is why traders should use protection tools.
About Triple Top
There are also other reversal patterns apart from those already described in this article.
The Triple Top formation is one of them. Let’s get a closer look at it now.
This pattern is similar to the Double Top. Their only difference is in the number of tops.
On the other hand, the Triple Top can be viewed as the continuation of the Double Top, as it usually forms when the two-top pattern does not work.
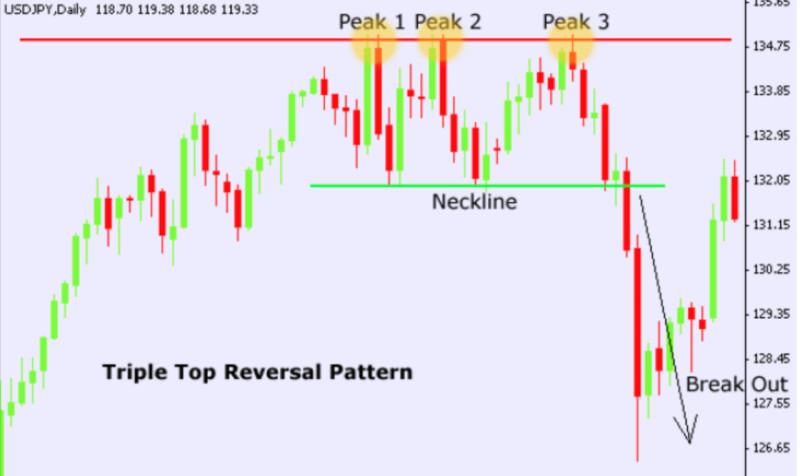
It is a perfect Triple Top pattern when all its peaks are at the same level and become resistance, while all its bottoms touch the support level.
However, the ideal Triple Top pattern is a rare occasion. In addition, it can be easily mistaken for the Head and Shoulders formation.
Still, it is important to remember that the highs of the pattern can differ slightly from each other in one or the other direction.
It usually takes the Triple Top up to six months to form.
There are two ways of applying this pattern when trading. The first one is a breakout strategy, which means a trade is opened when the price breaks through the support level.
The second one is a pullback strategy. The price breaks through the support level, returns to it, and then pulls back. This is the time to sell an asset.
All you need to know about Triple Bottom
The Triple Bottom is a pattern signaling a bullish reversal.
This formation is similar to the Double Bottom. Their only difference is in the number of lows.
The Triple Bottom formation is usually preceded by a prolonged downtrend. Its three lows follow one another and are located almost at the same level.
Their formation coincides with a decrease in trading volumes. When the third bottom appears, volumes begin to grow, thus confirming the strength of the pattern.
A buy signal is made when the price crosses the resistance level, which is plotted by the peaks of the Triple Bottom.
It is important to remember that this pattern can be easily mistaken for other formations, for example, the Double Bottom or the Rectangle.
If a Double Bottom is formed instead of a Triple Bottom, there is still nothing to worry about since both patterns indicate an impending reversal.
However, if you mistake it for the Rectangle, which is a continuation pattern, you risk losing money.
Therefore, it is necessary that you wait for a breakout through resistance or the supposed upper limit of the given pattern, and a steady rise in the price follows.
Another way of trading with the Triple Bottom pattern would be using the pullback strategy, i.e. the price breaks through resistance, returns to it, and then pulls back.
Difference between Head and Shoulders and Triple Top
The Head and Shoulders and the Triple Top are quite similar patterns. Their difference is that the so-called “head,” or the second peak, is above the shoulders, that is, above the first and the third tops.
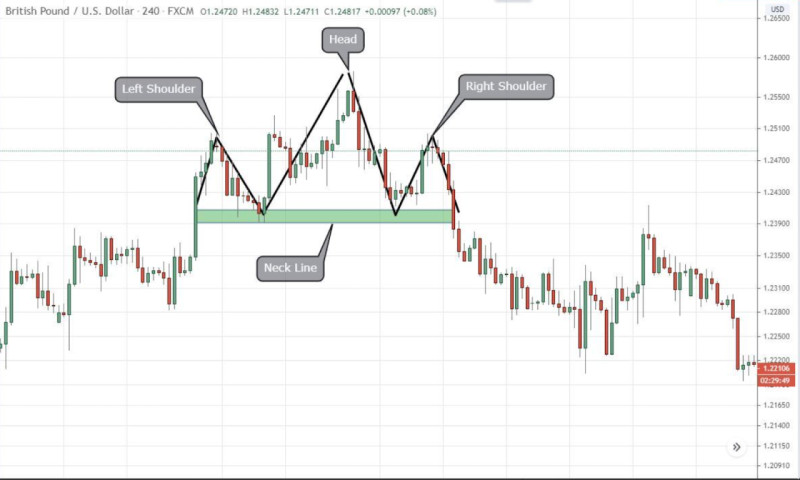
When the price goes below the so-called “neckline” (a line that separates the lows of this pattern), a bearish reversal occurs.
Entering the market using this formation becomes possible after the price breaks through the neckline, which is also a support level. Only in this case, the pattern is considered to be completed.
The Head and Shoulders formation is of greater importance when it is used in higher time frames. Moreover, it is one of the most common patterns.
The Inverse Head and Shoulders pattern works in a similar way but in the opposite direction. A bullish reversal occurs when the price crosses the neckline.
When using this formation, an additional signal can come when the price gets back to the neckline after a breakout in one or the other direction.
In case of the return, an additional trade can be opened in the same direction after the price bounces off the neckline.
Diamonds are traders’ best friends
One of the interesting and effective but rare reversal patterns is the Diamond. It is commonly used when trading in high time frames.
This formation is believed to generate weaker signals and even indicate a continuation rather than a reversal when appearing in the H4 time frame and lower.
Therefore, it should not be used in time frames lower than H4, as it can make a lot of false signals.
More reliable patterns are considered those appearing in the daily time frame and higher. At the same time, the longer the pattern forms, the more accurate the signal will be.
This pattern does not always have a perfect shape. However, when the Diamond’s shape is almost ideal, the signals it produces are stronger and more reliable.
The Diamond appears on the chart after a prolonged uptrend or downtrend. Fluctuations follow the trend. They increase first but then gradually decrease.
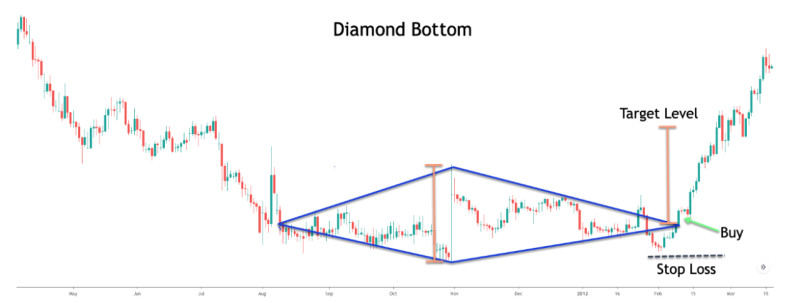
This is how this rhombus-shaped pattern is formed. Its two lower faces make the support lines, and the two upper ones make the resistance lines.
A signal to buy the asset is produced when the price breaks through the upper limit of the Diamond, indicating a bullish reversal.
Conversely, if the price leaves the limits of the pattern by breaking through support, a sell signal is made. This means that a bearish reversal occurred.
Graphical technical analysis patterns: candlestick analysis
As you now know, there are different types of price charts. The candlestick chart is one of them.
Candlestick analysis dates back to the 16th century but remains relevant up to this day.
Its key component is Japanese candlesticks and the patterns they form. Various types of candlesticks on the chart generate different signals.
Each candlestick has a real body and shadows. The body is the difference between the open and close prices, whereas shadows illustrated the high and the low.
Let's look at two such reversal patterns. They look similar and differ only in color.
They are the Hammer and the Hanging Man. Both candlestick patterns have long real bodies that can be either dark or light as well as long shadows.
The Hammer signals a bullish reversal.
Meanwhile, the Hanging Man, on the contrary, indicates a bearish reversal.
In addition, patterns on the candlestick chart can consist of more than one candlestick.
The Engulfing pattern is comprised of two candlesticks and can be both bullish or bearish. The formation appears when the price moves in a trend.
As for the Bullish Engulfing, the body of the first candlestick has a dark color, and the body of the following candlestick is light. The second candlestick, as if engulfs the first one, thus signaling a bullish reversal.
Conversely, the Bearish Engulfing shows a bearish reversal.
How to use Doji candlesticks
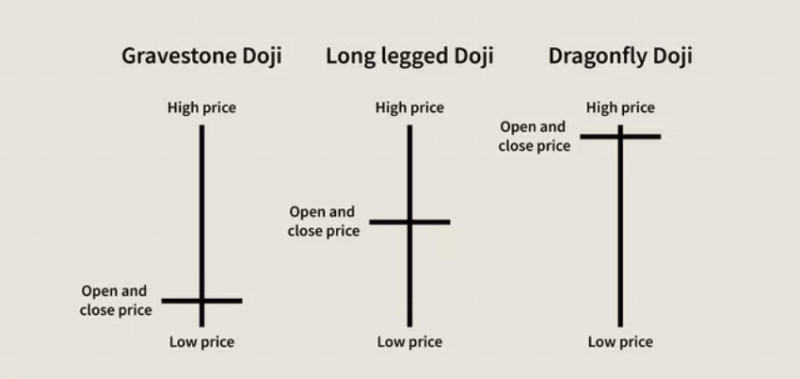
Speaking of candlestick analysis, a Doji candlestick deserves special attention.
This Japanese candlestick is different from the rest because it has long shadows but almost no real body. Still, its real body can be of three types:
- narrow and dark, meaning that the open price is slightly above the close price;
- narrow and light, indicating that the open price is slightly below the close price;
- in the shape of a line, reflecting that the open price is in line with the close price
In fact, when the real body of the Doji candlestick is in the shape of a line, such a pattern is considered to be perfect.
When several Doji candlesticks stand in line one after another, they are of little importance to traders. However, when a Doji candlestick follows the uptrend or a long light candlestick, it signals that a reversal is looming.
Still, this formation is only important when there is a strong trend movement. When the market is flat, this pattern makes little difference.
The Doji candlestick can be of several types. They are the Gravestone Doji and the Dragonfly Doji. Both patterns have a small real body and one long shadow. The Dragonfly Doji has a long lower shadow, while the Gravestone Doji has a long upper shadow.
A bullish reversal occurs when the Dragonfly Doji follows the long dark candlestick or appears by the end of a downtrend.
Meanwhile, a bearish reversal takes place when the Gravestone Doji follows the long light candlestick or emerges by the end of an uptrend.
Common technical analysis patterns: gaps
Whether it is the bar chart or the candlestick chart, you may spot price gaps when analyzing the market. So, what is a gap?
A gap is a sharp break in the price of an asset on the chart. It occurs after an unexpected spike in the price. Notably, gaps are hard to identify on the line chart.
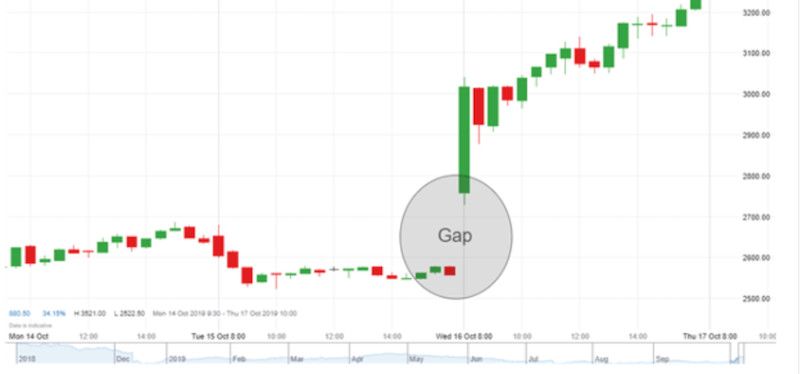
Such breaks illustrate a noticeable difference between supply and demand. That is, a gap exists when supply does not meet demand or vice versa.
Gaps also take place when important news comes, as it may cause market nervousness.
However, gaps are easier to predict when they occur in the intervals between trading sessions than when news comes.
Oftentimes, gaps occur in the market after the close on Friday, the opening on Monday, or on Sunday night. Such gaps are easy to find if you know the working hours of exchanges.
At the same time, it can be hard or almost impossible to foresee gaps on Forex when some news breaks.
There are several types of price gaps:
- Common gaps: they are not so big and usually get filled fairly quickly.
- Breakaway gaps: they can be found after consolidation when the price breaks through the range, goes in the same direction, and then forms a new trend.
- Runaway gaps: they occur when there is a clear trend and signals a prolonged continuation. When the gap closes, the price keeps moving in the same direction.
- Exhaustion gaps: these are gaps that take place at a time of a trend reversal.
Price gaps
There is another type of price gap. It deserves special attention because it is somewhat different from all the previous types. This is a Dividend gap, which is a sharp drop in the value of shares that does not exceed the amount of dividends.
Dividends are funds paid to all shareholders of a company. A company determines the amount of dividends to be paid.
Dividends can be paid quarterly, semi-annually, and annually. A company may opt not to pay dividends if it wants to use free funds for further development or does not get desired revenues.
In order to receive dividend payments, investors should make sure they are on the shareholder list before the ex-dividend date, the cut-off point for receiving dividends.
A company announces it wants to make dividend payments to its shareholders. Bidders start buying outs its shares. The company enjoys an increase in demand for its shares for several weeks.
When the ex-dividend date comes, a sell-off starts. Shareholders know they will receive dividends anyway, so they sell shares to earn even more money.
When dividends are paid, the value of shares falls sharply, forming a dividend gap. It then closes and the price returns to its previous level. Then, the gap closes, and the price stabilizes.
Sometimes, it can take the Dividend gap a few days to several months to close. In some cases, the price never reaches previous levels.
In other words, the Dividend gap can be another way to make money in the market.
Final thoughts
Formations on the chart can be divided into two main groups: continuation and reversal patterns.
Some of them occur regularly and are actively used by traders. Others, on the contrary, are rare and can be found under certain conditions.
In any case, it is important to make sure that a pattern is fully formed, as this is a signal to open trades.
Likewise, gaps provide valuable information about the market.


