


There are several common reversal patterns that can be used for trading any asset. The Double Bottom Pattern is one of them.
The pattern can be easily identified on the chart as its formation does not require any special conditions. Let’s explore this pattern in the article below.
To learn more about other technical patterns and their use in trading, read the article Full guide to main technical chart patterns.
What is a double bottom?
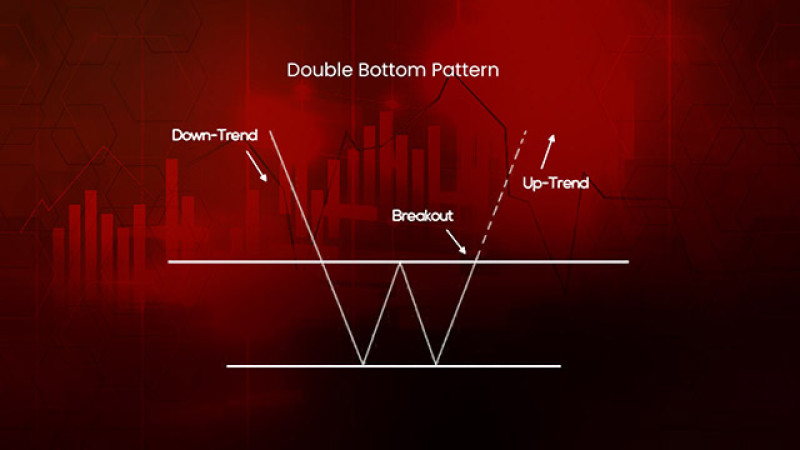
The pattern looks like a “W” letter and consists of two bottoms and a top between them.
This makes it easier for an inexperienced trader to spot this pattern on the chart.
The reversal pattern appears at the end of the downtrend and indicates that the price will soon move in the opposite direction.
The lower line crossing the two bottoms serves as support while the upper line crossing the top of the pattern acts as resistance.
The pattern looks simple on the chart if you know what to look for.
When the price reaches a certain level and bounces off it, the first low is being formed.
Then the price forms the local high when testing the resistance level but fails to break through it and pulls back to the downside.
This is how the second low is being formed. Traders need to be careful at this point: if the price falls below the support line, the pattern is considered inaccurate.
However, if the quote hits the second low and bounces off it, this confirms the formation of the double bottom pattern.
This time, the price should jump to the upside and break through the resistance line.
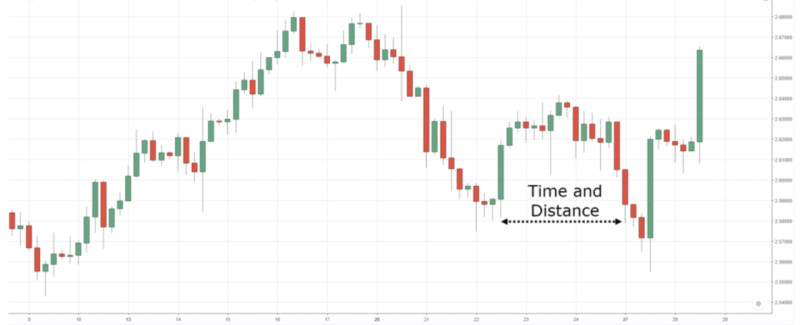
One important thing to consider is the distance between the two bottoms. The longer the distance, the more accurate the pattern is. So, the reversal is more likely to occur.
Ideally, the distance between the lows should be no less than six candlesticks.
If the two lows are located too far from each other, then this is not the double top pattern but something else.
Therefore, you should pay attention to this factor if you want to use the pattern efficiently.
Trading with Double Bottom
So, how do you trade with the double bottom? Let’s see when is the best moment to enter the market.
To make sure that the bearish trend is losing momentum, add the RSI technical indicator to the chart.
This oscillator indicator will confirm the oversold status of the asset, which means that the sellers are giving up and the buyers are gaining ground.
You may also notice that the second bottom is located a bit below the first one which shows that bears made another attempt to continue the trend.
At the same time, when two lows are located strictly at one level, this may mean that you are dealing with a false double bottom pattern.
When the price climbs to the upside after hitting the second low, the reversal is sure to come.
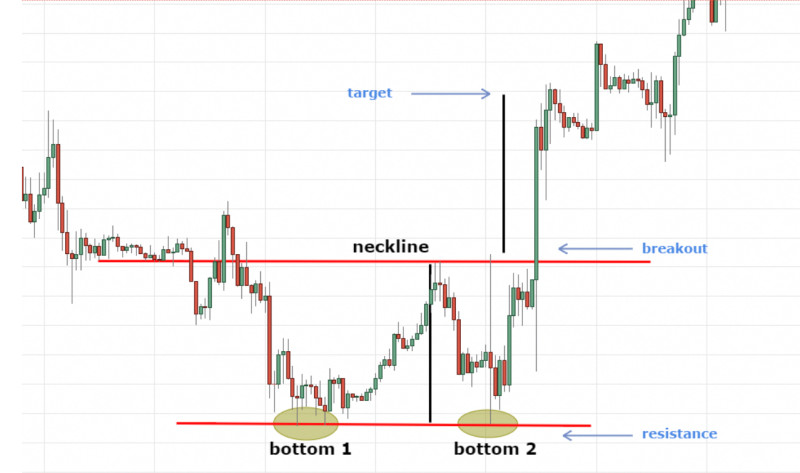
Now, you can open a trade as soon as the price breaks through the resistance line found at the peak of the pattern. This is the simplest way to enter the market.
You may also want to wait for a while to make sure that the trend has reversed. For this, you need to check that the price has returned to the resistance line after its breakout (at this moment, resistance turns into support).
After that, the quote jumps rapidly to the upside, thus developing a proper bullish trend.
Another way to find an entry point is to draw a trendline through the high from where the price began to decline and the local peak of the pattern itself.
The place where the price crosses the trendline will serve as an entry point for buying the asset. A Take Profit should be set at a distance found between the local lows and the high of the pattern.
Types of Double Bottom
There are several types of this pattern that differ slightly. Let’s see what they are.
1. Adam & Adam double bottom is observed when the price falls rapidly and the bottoms look narrow and long. After reaching the second low, the price makes a spike to the upside and continues to move up. Usually, the price does not test the support line and heads for the top. This is a very common type of the pattern.
2. Eve & Eve double bottom has more rounded and wide bottoms because they take more time to form. After breaking above the resistance line, the price usually returns there and resumes the uptrend after a rebound. This pattern is less common than the previous one.
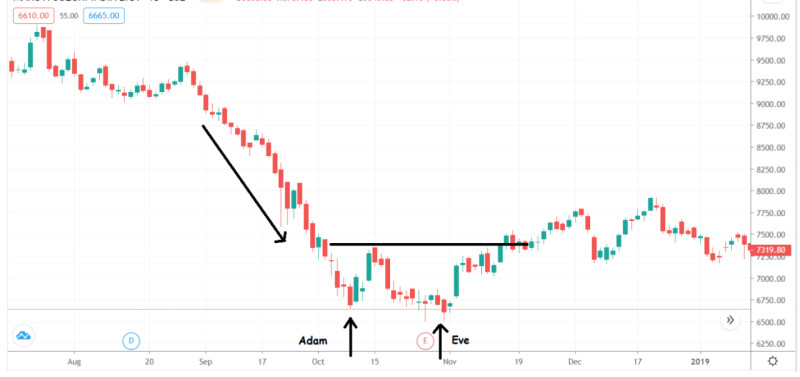
3. Adam & Eve double bottom is a combination of the previous two. It includes one narrow bottom and one wide, more rounded bottom. After breaking above the resistance level, the price can move along this level for some time before rising quickly. This is the most common type of the double bottom.
4. Eve & Adam double bottom is also a combination of two types but in a different order. First, we have a wider bottom which is followed by a narrow one. This is a very rare type and it accounts for the majority of false breakouts.
Double Bottom and other patterns
The double bottom pattern has some features similar to other technical patterns. Read the article Full guide to reversal and continuation trend patterns to better understand and detect different types of patterns.
A double top and a triple bottom belong to the same “family” as our pattern.
A double top is a very similar reversal formation but with an opposite meaning.
The main difference between them lies in the fact that the double bottom predicts the end of the downtrend and the start of the upward movement. The double top pattern appears when the price is about to decline after an extended advance.
Another similar formation is a triple bottom. Some traders even view it as the continuation of the double bottom.
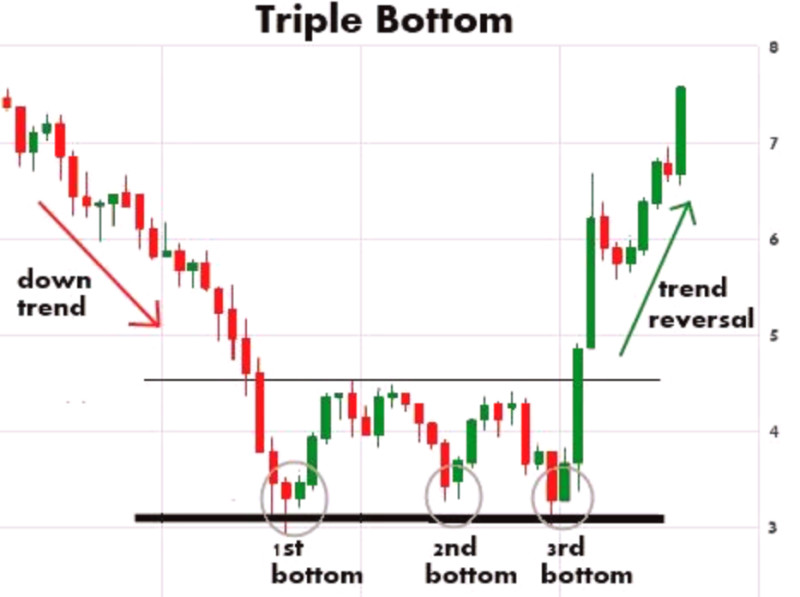
The triple bottom pattern also indicates a change in the downtrend but its signal is considered to be stronger than that of the double bottom.
The formation of the two patterns shows that bears are trying to regain ground. So, the asset moves below the previous level under strong bearish pressure.
In a double bottom, this happens twice, and in a triple bottom, the price forms three lows.
Yet, despite all the effort, bears fail to hold the price at the low and it rebounds to the upside after reaching the bottom.
In a double bottom, the price changes direction after hitting the second bottom and rebounding from it. It then breaks through resistance and continues to move upwards.
In a triple bottom, the price makes two attempts to move to the upside but falls under selling pressure. Finally, it forms an uptrend after hitting the third bottom.
Pros and cons
Each method of technical analysis has its advantages and disadvantages which is also true about the double bottom pattern. Let’s see what they are.
Advantages:
- Very common. This pattern can be frequently found on the chart which makes it easy to spot and use in trading.
- If all conditions are met, the likelihood that this is the right pattern is higher than with other less common patterns.
- Easy to identify. Clear rules of formation make it easy to recognize the pattern.
- Suitable for beginners. To trade with a double bottom, it is enough to set support and resistance levels and monitor the trajectory of the price. This is the basics that a beginner should know.
- Suitable for different assets. This pattern can be found on the charts of different assets, including stocks and cryptocurrencies, which is why it can be applied to various markets.
Disadvantages:
- Various interpretations. This is a common disadvantage of many patterns as different traders tend to see their formation differently. Gaining more experience and studying quotes records will help you avoid false interpretations.
- Sometimes generate false signals. This pattern produces weaker signals compared to the triple bottom. Using additional technical tools will help you confirm the signal.
Strategy
To trade efficiently, you need to have a clear-cut strategy and strictly adhere to it.
The main idea behind any strategy is that a trader cannot be caught off guard. The rules of the strategy are clear and cover various market situations.
This is why a trader won’t be panicking if something goes wrong because he/she knows exactly what to do.
Those traders who don’t follow a strategy are usually more vulnerable to stress and panic and tend to open or close positions erratically.
Trading strategies can be subdivided into categories based on various parameters. One of them is a time frame.
Based on the time frame, we can distinguish short-term, medium-term, and long-term strategies. A short-term strategy is also called an intraday strategy when trades are opened and closed within one day.
The double bottom pattern is more effective when used in a long-term strategy which implies that trades can be held open for several days and even months.
Long-term strategies are used on higher time frames. This reduces the amount of price noise and gives more accurate signals.
On lower time frames, different chart patterns can be formed but some of them may turn out to be false.
Patterns on higher time frames are considered to be more reliable as they take more time to form.
However, the double bottom pattern can be successfully traded on the intraday and medium-term charts.
Trading recommendations
To take full advantage of working with this chart pattern, traders should follow certain rules below.
1. As a rule, an asset which is more popular among traders has a higher chance of forming an accurate pattern. The same is true about the double bottom.
2. Pay attention to the distance between the two bottoms: it should not be less than 6-10 candlesticks.
3. The pattern should be preceded by a steady downtrend continuing for some time.
4. Don’t look for ideal patterns that you see in the pictures online. In real life, patterns look a bit different which does not make them less accurate.
5. It is better to use the Japanese candlestick analysis as it covers more price parameters than linear charts.
6. Consider how far the local high is formed. It should be a minimum of 10% rise from the local low. Otherwise, the pattern won’t work out.
7. The more accurately the pattern is formed, the higher the chance that it will work out. Other traders will also recognize this pattern on the chart and start actively using it.
8. It is believed that a proper double bottom should be formed within a month. So, keep this in mind when you see something similar on the chart.
9. The double bottom pattern is more accurate when formed on higher time frames. So, it is advisable to use it in long-term strategies but short-term and medium-term strategies will also work.
10. As you make sure that a real double bottom is being formed, you can set pending orders before opening a trade. This will save you from being glued to your monitor.
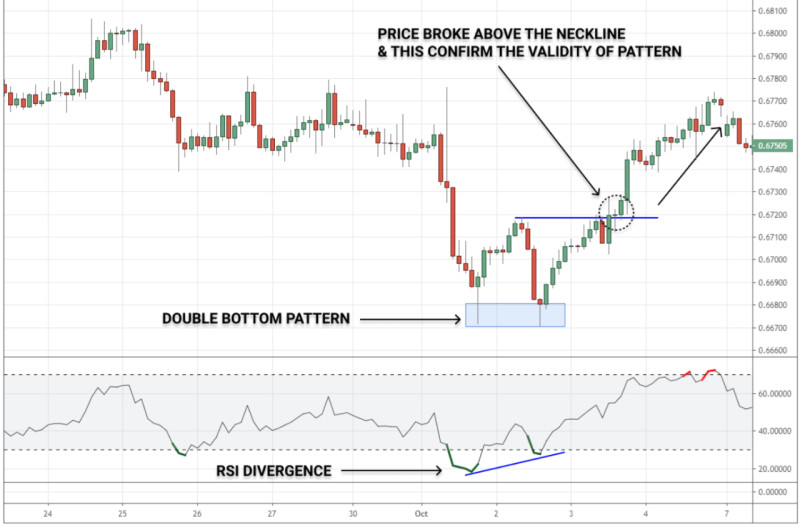
11. Use additional tools to confirm the accuracy of the pattern and a change in the trend. For example, the RSI indicator will show you the oversold status of the asset which indicates that bears are losing momentum.
12. This pattern can be used when trading cryptocurrencies. Yet, traders need to keep in mind that this pattern is much less common in crypto trading than in forex trading. Besides, cryptocurrencies are very volatile.
13. Manage your risks wisely. No pattern, including the double bottom, can guarantee a trend reversal. Therefore, you should use a certain percentage of the deposit for each trade.
Conclusion
Each method of technical analysis has its advantages and disadvantages which is also true about the double top pattern.
This is a very common pattern, especially its Adam & Adam variation. The Eve & Adam type is less common.
The double bottom pattern is very similar to the triple bottom. Some traders even view the latter as the continuation of the double bottom. A triple bottom means that bears made another attempt to break through the low but failed to do this, and the trend finally reversed.
The simplest way to trade this pattern is to open positions at the moment when the price has passed the resistance.
The second option is to wait until the price returns to the resistance line after its breakout and then moves steadily upwards.
You need to check whether the pattern has been formed correctly and whether it is false or not. To confirm the accuracy, check the distance between the two bottoms. It should be no less than 6 to 10 candlesticks.
It is also important to check how far the local high is formed. It should be at least 10% of the distance between the high and the first low.
Read more
Triple Bottom Reversal Pattern
Full Guide to Double Top Pattern
Diamond Chart Pattern in Technical Analysis
Full Guide to Head and Shoulders Pattern
Full Guide to Wedge Chart Pattern
Flag Pattern in Technical Analysis
How to use Cup and Handle Chart Pattern
What is a Doji candlestick and how to use it
How to use Pennant Chart Pattern
What is Gap in FX and Stock Trading
What is Dividend Gap and when is it formed
Japanese Candlestick Patterns in Technical Analysis


