


The chart itself is rather informative even without any additional tools. Most of the time, you simply need to analyze the trajectory of the asset to understand when to enter the market.
When moving on the chart, the price forms certain patterns that can indicate the continuation of the current trend or its potential reversal.
In this article, we will talk about the patterns signaling a reversal or continuation in the trend.
Continuation and Reversal Patterns
Every pattern has its meaning. Thus, continuation patterns indicate that an asset is going through a pullback or a correction after which it will continue to move in the same direction.
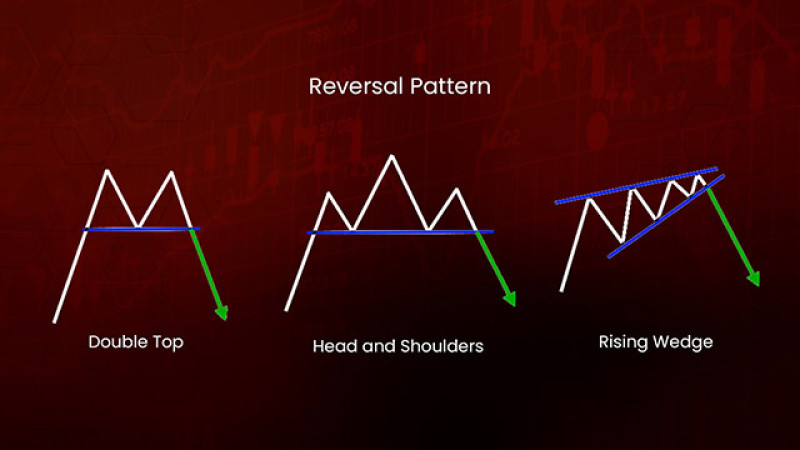
When a reversal pattern occurs, this is a sign that the current trend has reached its peak and is about to lose its steam which predicts a change in the price direction.
When you see a continuation pattern, you should open positions in the direction of the trend. On the contrary, with a reversal pattern, you need to open positions according to the trend that is being formed.
It may sound simple at first: go with the trend when it continues and trade opposite when it reverses.
However, in practice, it turns out to be a bit more complicated for several reasons.
First of all, the description of the pattern you find online may not be accurate enough to help you define the pattern on the chart.
What is more, we tend to look for ideal patterns that actually don't look so perfect on real charts.
Secondly, recommendations that you usually find online teach you to spot a pattern only when it has been completed. To enter the market at the right time, you need to recognize the pattern at the initial stage of its formation.
Finally, these instructions usually miss out on one important aspect which is the time frame where you should look for the pattern.
There are different time frames, from the shortest to the longest ones. Oftentimes, if you check the same asset on different time frames, you will see different patterns.
This also adds confusion to the situation as a trader is not sure about which chart to follow.
Connection between fundamental and technical analysis
In addition to all the factors mentioned above, traders need to take into account fundamental factors such as important economic releases and political news.
Markets always react to this background so it should not be ignored. Many trading platforms feature economic calendars that show upcoming important events for the day, week, or month.
As a rule, markets move faster when important news is released. Therefore, you should know how to act at this since there is a close connection to technical analysis.
It is a big mistake to rely only on one type of analysis. To be successful in trading, you need to combine technical and fundamental approaches.
Most of the time, traders make mistakes because these two methods can show a different picture.
But there is an explanation for this. The fact is, markets factor in the events even before they actually occur.
Even though market participants are aware of the upcoming events, they cannot possibly know the outcome of these events in advance.
Besides, some events cannot be predicted (wars, floods, earthquakes, and so on) but can still strongly affect the market.
To analyze currency pairs, you need to check important events in both countries that may potentially influence the trajectories of the two currencies.
This includes analyzing several economic indicators.
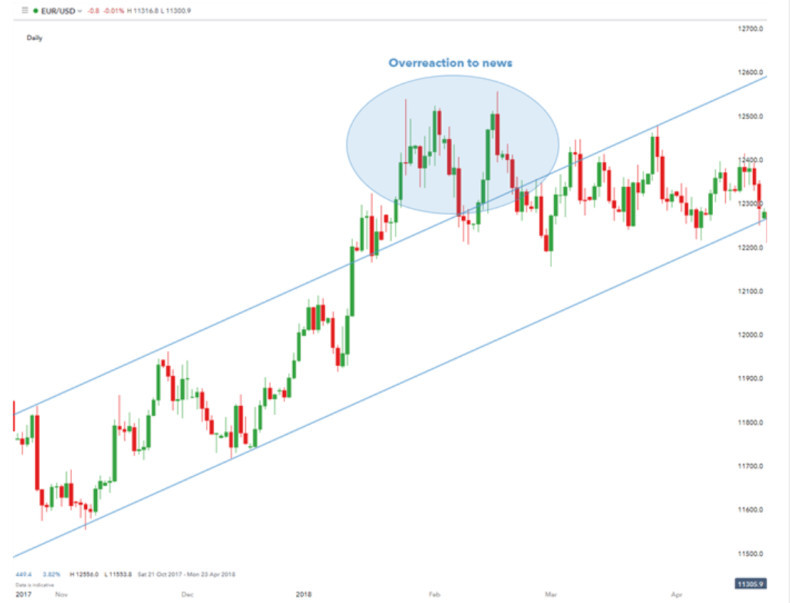
However, expectations and forecasts do not always come true. When forecasts are close to the actual reading, the market reaction is moderate.
When the actual reading turns out to be far below or above the forecast, a stronger movement can start. This is when sharp price fluctuations begin to appear.
When forecasts turn out to be completely wrong, the market trend starts to reverse.
Buy the Rumor, Sell the Fact
Speculation usually precedes the release of important news.
This strategy is rather common, especially among beginners.
According to it, a trader needs to make quick decisions based on speculation so that he/she can be the first to enter the market with a profitable trade.
As soon as speculation appears, a new trend emerges in the market. The faster the rumor is spreading, the stronger the trend is.
The most common speculation is about the interest rate hike. For the stock market, this is a bearish factor, while for the forex market, this is a driver for the national currency.
Then the trend is gaining momentum until the information is confirmed or refuted. In most cases, this price changes direction at this point.
This illustrates our point mentioned above: the market factors in all important news before its official release.
At the same time, you need to understand that some speculation might turn out to be wrong.
Monitor the market carefully to get the first signs of distrust.
This strategy works out only half the time due to several factors.
When everybody knows the rumor, this makes it no secret that could have been potentially used by a trader to his/her advantage.
Besides, this method can hardly be applied to Forex as currencies have fewer rules that shape their trajectory.
As a rule, the strategy can be well justified when the market movement has already happened.
Reversal Patterns
Let's discover some of the reversal patterns and possible difficulties in identifying them.
Among the common chart formations are the double and the triple top pattern as well as their opposite analogs, the double and the triple bottom.
These patterns can generate false signals and in order to eliminate them, we recommend using divergences that are best identified with the help of oscillators, such as the RSI.
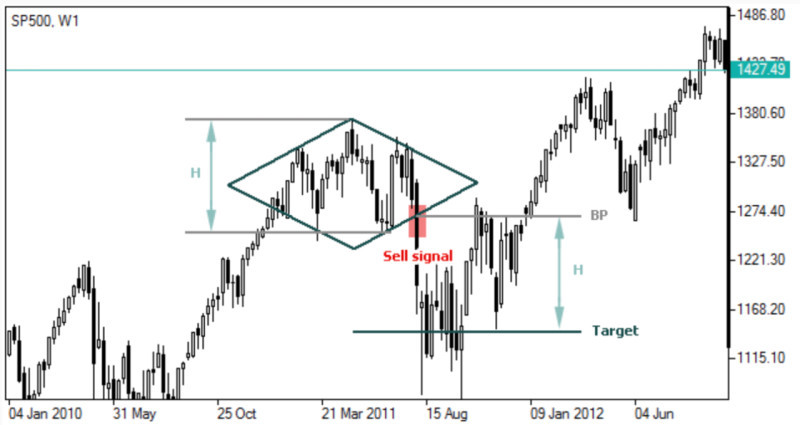
One of the classic examples is the diamond pattern which is rather hard to detect on the chart as it can resemble the head and shoulders pattern at the very beginning.
Those who only write about technical analysis can declare a pattern only when it has been fully formed. This is not a way out for traders as they need to recognize the correct pattern at the initial stage of its formation.
If the current trend is about to change to the opposite, you need to close previously opened positions and open new trades in line with the upcoming trend.
To better spot these patterns on the chart and confirm their signals, use various technical tools such as volume indicators, for example.
However, we know that real Forex trading volumes can hardly be calculated. So, we can only count on tick volumes that measure the number of price changes instead of the number of opened trades.
Therefore, using only this type of indicators may not be enough to trade Forex. You can combine them with other technical tools such as Elliotte waves, Fibonacci levels, etc.
Exploring reversal trend patterns
Let’s discuss other reversal patterns and their characteristics in real trading.
The head and shoulders pattern, as well as its inverse variation, is considered one of the most common reversal formations.
Many educational resources illustrate the head and shoulder pattern in a clear-cut schematic way which may differ greatly from what you may see on the real chart.
Besides, when waiting for the completion of the pattern, traders often lose the opportunity to maximize their profit as they miss the right entry points.
Sometimes, the pattern is not complete which signals the continuation of the trend.
This is the case when the Hound of Baskerville pattern can form. It appears when the price does not reverse after the head and shoulders pattern shows up on the chart and continues to move in the previous direction.
This discussed pattern is not considered common. It is rather controversial and some traders refer to it as a continuation pattern.
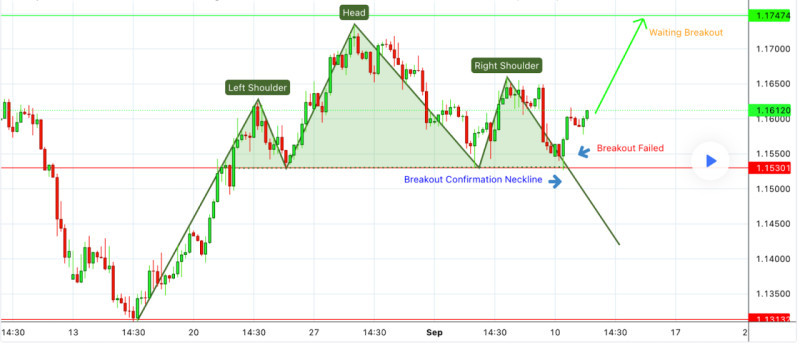
In a nutshell, the price makes a false breakout of the head and shoulders neckline and continues to move upwards.
The Hound of Baskerville pattern is considered fully formed when the price breaks above the head line.
Then you can close current trades opened for the head and shoulders pattern and open news once following the bullish trend.
The inverse head and shoulders pattern functions in a similar way with the only difference being that it confirms a downtrend, not an uptrend.
Less popular reversal patterns
Some technical patterns are not so common in trading and a spike pattern is one of them.
A spike occurs when the price forms a swing high when going up or a swing low when moving down. As a rule, a spike is followed by a rapid change in the trend.
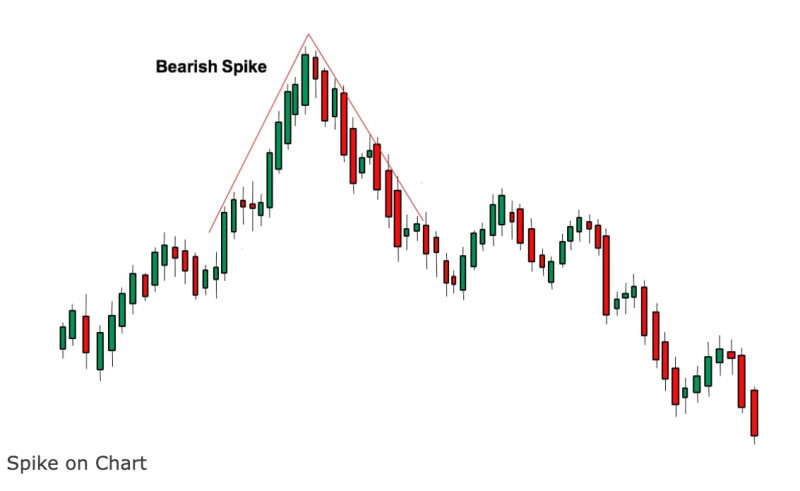
When a spike happens, it looks like the market got out of control and exceeded all expectations.
These patterns can be quite confusing as they are usually not preceded by any preparation phase or warning signals. They show up unexpectedly in the rapidly changing market.
At the same time, this is not a rare pattern. You just need to know the difference between a corrective spike and a reversal spike.
This kind of pattern usually appears on shorter time frames but they still need to be confirmed on longer ones. Only then can we be sure that we are dealing with a reversal pattern.
The price can form numerous small spikes on lower time frames which do not necessarily predict a trend reversal.
When this pattern is confirmed in longer time periods, it becomes more reliable.
However, most theorists do not tell you exactly when to enter the market when this pattern is being formed.
This might be because it is very difficult to foresee its formation on the chart.
Continuation trend patterns
Let’s explore more of the patterns that indicate the continuation of the trend. The pennant pattern and the flag pattern are considered the most reliable ones.
They are pretty much identical with the only difference being that the flag comes in the form of a parallelogram, while the pennant appears in the shape of a triangle with its peak lying horizontally.
Usually, their formation comes after a rapid and significant movement in the asset’s price.
Then the price behaves like it needs a breather before the next cycle of a rally. This is when these patterns begin to emerge on the chart.
The breather can last from one to three weeks on average and can go in parallel with decreased trading volumes.
The patterns usually appear in the middle of the ongoing trend which confirms that the price is strong enough to continue its current movement.
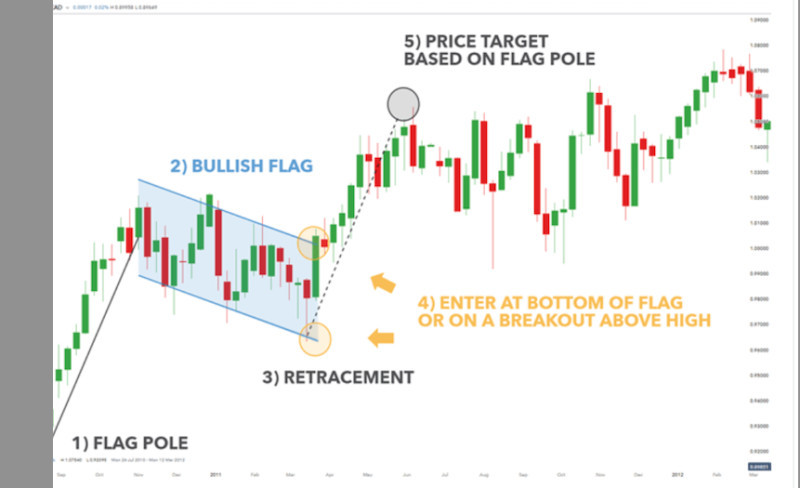
After the patterns are built, the next upward target for the price will be located at a distance equal to the so-called flag pole that was formed before.
Notably, the flag pole is located almost perpendicular to the time chart and can literally consist of several large candlesticks.
These patterns are very typical of markets and assets with strong fluctuations, for example, Forex.
It was noted that when an asset is declining, these chart formations tend to appear faster.
Some traders believe that the pennant pattern looks similar to a triangle. However, you should keep in mind that it takes much longer for a triangle to form.
Less common continuation patterns
Among interesting but not so common continuation patterns is the Cup and Handle pattern.
Its name speaks for itself: it resembles a cup which is then followed by a small handle. The appearance of this “handle” part is essential since this is when traders start looking for entry points.
Ideally, the depth of the cup should be no more than 80% of the previous price movement, while the handle should be no lower than the first half of the cup.
There are three main strategies to trade this pattern:
- An aggressive approach is definitely the riskiest one. It implies entering the market when the price crosses the upper line of the handle.
- In a standard approach, wish is less risky, positions are opened after the price passes the line of the cup located a bit higher than the upper line of the handle.
- In a conservative approach, which is the safest one, you need to wait for the price to break through the boundary of the pattern. Then the quote has to return to this level and test it from bottom to top to bounce off it.
It is crucial for a trader to know how to recognize a real pattern and distinguish it from the false one. For this, you need to use a time frame no lower than H4 or even higher than that, for example, D1 or W1.
As we have already mentioned, it is advisable to use additional technical indicators for confirmation.
To make sure the cup and handle pattern is accurate, traders apply the 200-period moving average.
If the formation is built correctly, then the moving average will be passing below the handle line.
A gap as another continuation pattern
In the period when a trading session ends on one day and another session starts the next day, a lot can happen in the market. This is when price gaps occur.
It is easy to understand why a gap can appear in stock market trading.
It is far more difficult to explain why gaps happen in the forex market which is working round the clock, except for weekends.
According to forex specialists, gaps can appear only between the close of the session on Friday and the opening of the trade on Monday. In practice, however, things are different.
Therefore, traders should understand the consequences of a gap and know the ways to trade when a gap has happened.
There are two types of gaps. The first one indicates the continuation of the current trend. The second one called an exhaustion gap signals a possible change in the price direction.
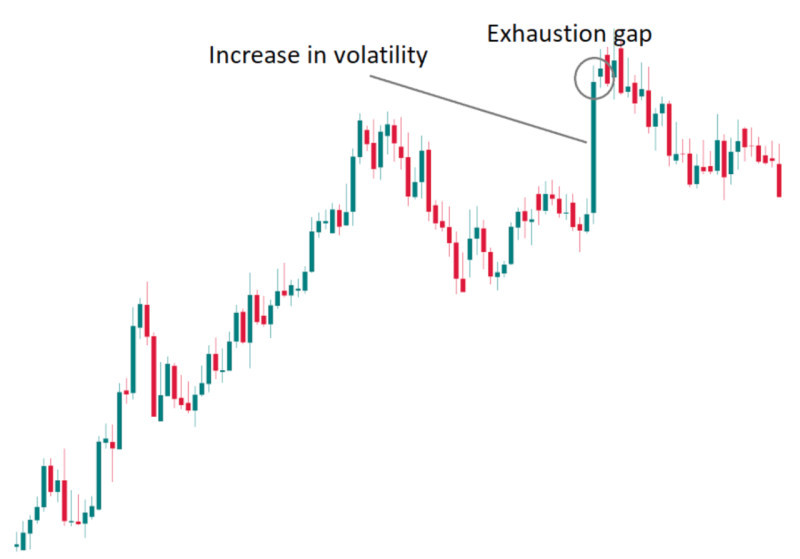
The trick with using gaps is that it can be identified as a continuation or exhaustion pattern only after its actual completion. Sometimes it is possible to spot an exhaustion gap at its very early stage.
We recommend opening positions at the moment a gap emerges on the chart in the direction of the current trend.
In case of a reversal gap, trades should be opened in the opposite direction.
Reversal candlestick patterns
Candlestick technical analysis is one of the most accurate and efficient methods since it covers the high and the low of the price as well as the difference between opening and closing levels.
Japanese candlestick patterns can be quite self-sufficient in technical analysis. A candlestick of a particular type can already indicate an upcoming change in the trend.
Some candlestick patterns are more common while others are less popular. A trader needs to know what each pattern means.
The most frequent candlestick formations include a hammer, inverted hammer, bullish harami, and bearish harami.
A hammer has a small body and one long lower shadow, while an inverted hammer has one long upper shadow.
Both hammers appear when a downtrend is coming to an end and the price is about to reverse to the upside.
A bullish harami consists of two candlesticks, with one of them having a long body and one or two short shadows and the other one featuring a short body and longer shadows. The second candlestick has a different color.
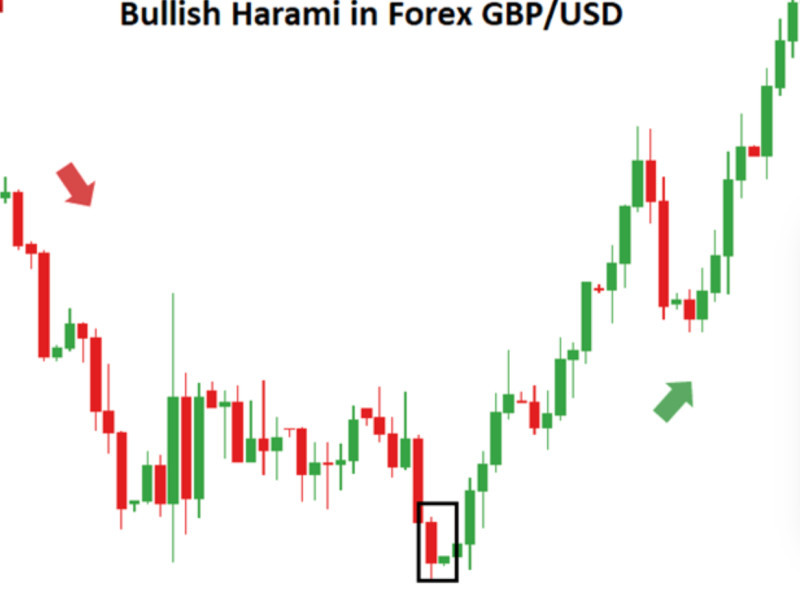
It may look like a taller candlestick is followed by a substantially shorter candlestick, thus resembling a pregnant woman.
But when a shorter candlestick appears first, this means that a bullish engulfing is being formed.
A bearish harami differs in the way that it predicts a reversal of the uptrend and the start of the downtrend.
To confirm both patterns, you need to make sure that the shorter candlestick is followed by another candlestick with a long body of the same color.
Pros and cons
Each method of technical analysis has its advantages and disadvantages which is also true for the reversal and continuation patterns. Let’s see what they are.
Advantages:
- Easy to use. Basically, this method does not require any additional technical tools. You only need a chart to see price fluctuations and that’s it. The patterns emerge from these price movements and provide traders with all the necessary information.
- Suitable for both beginners and experienced traders. Before using indicators, one needs to figure out the formulae and the ways these indicators are plotted on the chart. In our case, you can simply use the chart itself to look for particular patterns.
- The rules of formation are clearly set out. Each pattern is built according to a certain order which makes it rather easy to identify and interpret them.
- Suitable for trading different assets. These patterns can be applied to different assets and used on different time frames.
- In contrast to indicator analysis, signals generated from these patterns cannot be remade or be late. The fact is that we are dealing directly with price movements rather than signals derived from the price by other indicators.
- Highly accurate and very common. If the pattern is formed correctly, the entry signal can be followed without hesitation. Besides, these patterns frequently appear on the chart which makes it easier for a trader to open as many trades as he/she needs.
Disadvantages:
- Different interpretations. This is the biggest drawback of this method. It turns out that different traders can see different patterns on one and the same chart. This means that the signals they get are interpreted differently which leads to absolutely opposite trades. Therefore, interpretations largely depend on traders’ experience and their knowledge of the patterns.
- Time frames matter. The fact is that accurate and correctly formed patterns tend to appear on higher time frames. However, unfortunately for many traders, these patterns and their signals do not appear that often in longer time periods.
Automated trading
In practice, finding a pattern on the chart can be more challenging than it sounds. Most of the time, real patterns do not look as ideal as presented in the pictures above.
Besides, one of their disadvantages is different chart reading.
One trader may see a pattern, while another trader may see a different pattern, and the third trader will not see anything at all.
This happens due to several reasons. First of all, a lack of experience and knowledge can play this trick. To recognize a pattern on the chart with no effort, a trader needs to master the skill.
So, one chart setup can have different interpretations among traders which can lead to opposite trading decisions.
As a result of wrong chart reading, some traders get losing trades.
What is more, when trading aggressively, traders may want to open a position before the pattern is fully completed. In this case, there is always a risk of a failed pattern or a completely different pattern which may also cause losses.
Today, various trading programs are at your disposal to make your trading life easier. Thanks to built-in algorithms, these trading advisors can accurately detect the formation of a pattern in no time.
Such trading advisors can monitor the chart non-stop without any breaks. They are immune to emotional or stress factors and generate an entry signal only when an accurate pattern has been formed.
Trading recommendations
To take full advantage of trading with continuation and reversal chart patterns, traders should follow certain rules that we have outlined below.
1. Gain more experience so that you can recognize different chart formations and distinguish between them.
2. To start with, practice detecting patterns by studying the history of quotes. This is an especially useful tip for novice traders who tend to see a pattern when there is actually none.
3. Do not build imaginary parts of the chart to make the pattern seem complete. You should rely only on actual price movements.
4. Real chart patterns may look different from what you see in the pictures online.
5. Both reversal and continuation patterns are formed within resistance and support lines, or trendlines.
6. Almost all patterns have similar entry points for gaining profit. To identify this point, you need to measure the depth of the pattern and set the next target at a distance similar to that depth value.
7. As a rule, patterns are considered more accurate when formed on higher time frames. On lower time frames, the price goes through numerous fluctuations that at one point may look like patterns.
8. Learn how to distinguish a correction from a reversal point. At an initial stage of a formation, some continuation and reversal patterns may look alike. Do not rush to conclusions and wait until a pattern is fully formed. Only then can you open a trade.
9. You can supplement chart patterns with additional technical tools that will confirm or eliminate signals you receive from the patterns.
10. Remember that reversal patterns are usually preceded by a strong trend movement. They do not occur during a flat movement.
11. The larger the pattern is, the more intensive the price movement will be after its completion.
12. Some patterns require a particular number of waves to be deemed completed. If a pattern does not form the required number of waves, it is considered inaccurate. For example, the pennant pattern should include 3 to 4 waves and the flag pattern should have up to 7 waves.
Conclusion
To analyze the market situation efficiently, you need to include both technical and fundamental analysis. Many traders use only one of them, but it is better to use them together.
In this article, we have discussed one of the methods of technical analysis which implies identifying patterns on the chart. This method is very convenient because it does not require any additional tools except for the price chart.
At the same time, its main drawback is that these formations can have different interpretations. On the same chart, different traders can see different things
To avoid confusion, increase your expertise in this sphere or use automated programs designed to search for patterns on the chart.
At some point of formation, reversal and continuation patterns can look very similar. If a pattern has been formed on the lower time frame, check it again on the higher one.
Signals formed on longer time intervals are considered more accurate.
It is a good idea to use candlesticks in your analysis. Candlesticks are very informative and their appearance on the chart can already serve as a signal.
Read more


