


Some technical chart patterns are not so common but still effective when used in trading, and the Triple Top is one of them.
Let’s discuss its main features and associated trading strategies in the article below.
To learn more about other technical patterns and their use in trading, read the article Full guide to main technical chart patterns.
What is a Triple Top?
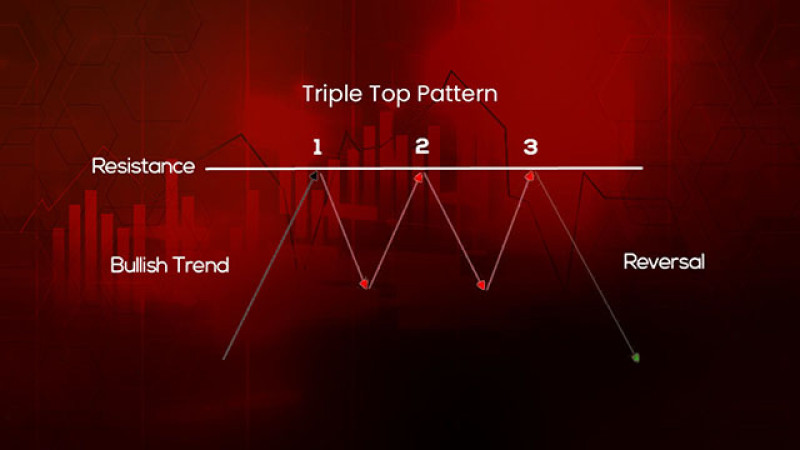
This is a reversal pattern that predicts a change in the uptrend. It appears when bulls are losing momentum and bears are gaining ground.
To be considered accurate, the pattern must occur after a well-pronounced uptrend. Moreover, the upward movement should be unfolding for some time, from one to several months.
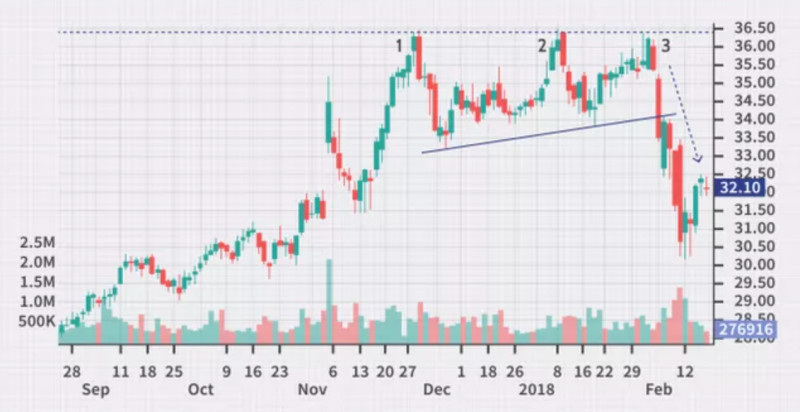
The three peaks should appear one after another at approximately the same level (with a difference of no more than 1-2%). This is an important condition because these highs will form a resistance line.
The three local highs are formed with two pullbacks in between. These lows should be formed at nearly the same price level as this is where the support line will be built.
The pattern is considered complete when the third peak has been formed and once the price moves below the support line.
The breakout of the support line which later turns into resistance means that the uptrend has been fully changed into the downtrend.
Increased trading volumes can be also used as a confirmation of the pattern when trading Forex.
The price may test the new resistance level several times without crossing it. Instead, it rebounds from this level and continues to move down.
This pattern is deemed reliable and accurate only if it has been developing for a long time which can be a month.
Some traders see this pattern as the continuation of the Double Top as it occurs when the latter fails to form.
In this case, bears make three attempts to take control of the price but still fail to do so and lose their grip.
Triple Top and other patterns
All chart patterns can be divided into two categories: trend continuation and reversal patterns. Read the article Full guide to reversal and continuation trend patterns to better understand and detect different types of patterns.
Despite being a reliable pattern, the triple top can still be confused with other chart formations of the same category or with absolutely opposite patterns.
The formation of the triple top starts with the double top pattern which is also a reversal pattern signaling the start of the downtrend.
If a trader decides that he/she is dealing with the double top and misses the completion of the triple top pattern, then the entry point will be wrong and may bring losses.
Therefore, it is better to use technical indicators together with chart patterns to confirm their formation.
For example, if a trader sees no technical confirmation of a double top, then a third peak may be on the way to complete the triple top pattern.
The triple top is visually similar to the Head and Shoulders pattern where the second peak is located above the first and the third one.
All the patterns discussed above belong to the reversal group of patterns. So, confusing them won’t be very critical.
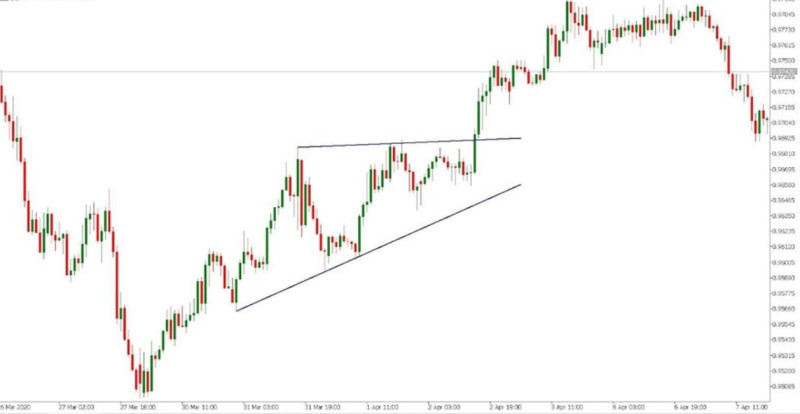
The tricky thing about this formation is that it can be mistaken for such continuation patterns as a rectangle and an ascending triangle.
During a correction, a trader may decide that a continuation pattern is being formed. However, traders may suffer serious losses if a reversal pattern appears instead.
Trading with Triple Top
So, how do you trade with the triple top? Let’s see what are the best ways to use it.
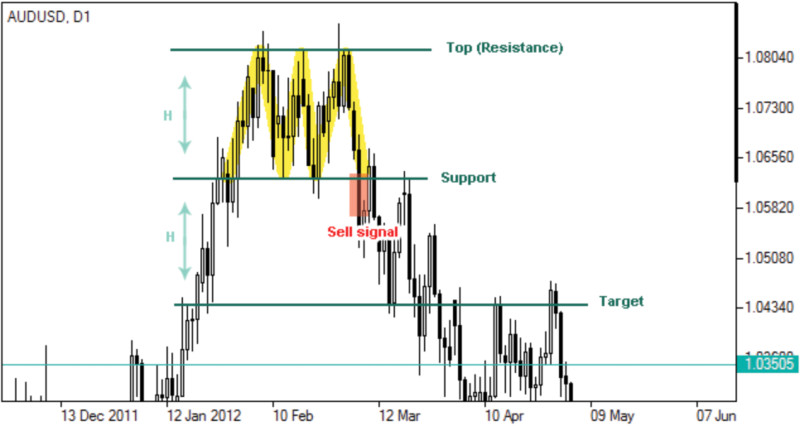
The simplest strategy is to wait for the completion of the pattern. You can choose to enter the market once the price breaks below the support line.
This is an aggressive approach but there are less risky options as well.
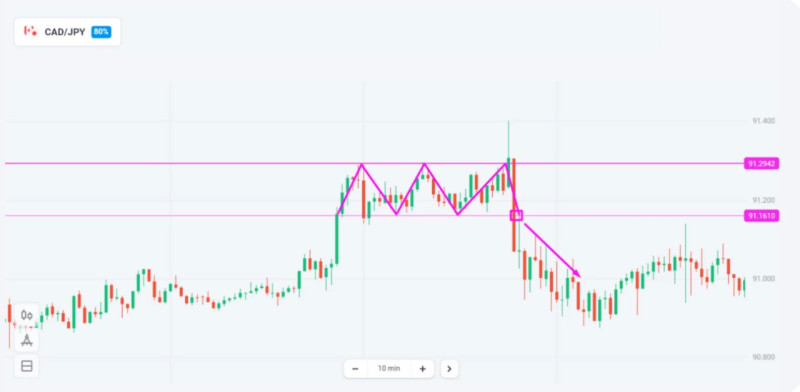
When trading aggressively, you need to wait for the price to break below the level formed by swing lows which now acts as new resistance.
Then the price returns to this level and tests it but later rebounds from it and continues to move downwards.
This trading method has one disadvantage: the price may never return to this level and may simply continue to fall. This is how you can miss a good moment for opening a position.
To be on the safe side, you can open a trade with a reduced lot at the moment when the price breaks through the support level. Then you need to monitor the market.
If the quote moves back to this level, rebounds from it and continues to move downwards, you can open a trade of a larger volume.
To set the targets and a Take Profit, you will need to check the distance between the local highs and lows of the pattern.
The higher the pattern, the further the target is set.
Trading strategies
Trading with the triple top can be done in other different ways.
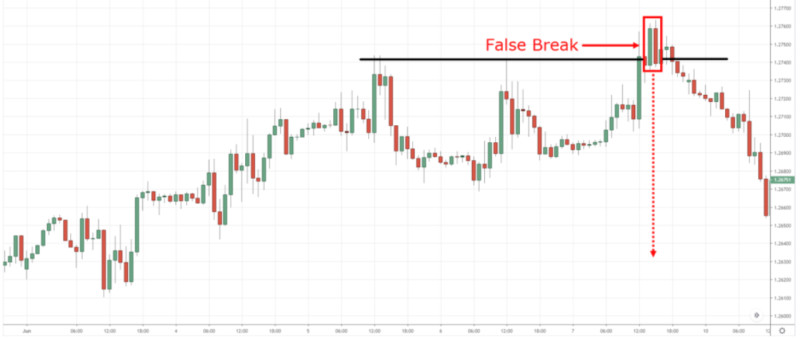
For example, when the third high is being formed, the price can perform a false breakout of the resistance line. A false breakout means that the price crosses resistance but won’t move further upwards.
Then the price falls, indicating the start of the downtrend.
In this case, the next candlestick that follows a false breakout should be used as an entry point.
Sometimes when the pattern is complete, it can be too late to enter the market as you won’t get the desired profit.
In this case, you should wait for the consolidation phase when the price is fluctuating within a narrow range alongside the support line. This indicates that the bullish pressure is easing.
After a short consolidation phase, the price falls below the support level and moves steadily to the downside.
We have already mentioned that the price may pull back slightly after the first breakout. But sometimes it can test the new resistance level twice.
If you see these signals in the form of candlesticks or their combinations (bearish engulfing is one of them), you can open a sell trade following the formation of the next candlestick.
So, these were additional options for entering the market when trading with a triple top. In other words, you can gain profit both when the price is crossing the support line and when it has already done so.
Confirming Triple Top formation
As we have already mentioned above, the triple top is a rather reliable pattern. Yet, we recommend using additional technical tools to confirm its accurate formation.
Volume indicators are among such tools as they measure the number of trades opened on a particular instrument.
On Forex, real trading volumes are hard to define so we take into account only tick volumes. The tick volume indicator shows the number of price changes instead of the total number of trades.
Actually, there is a close correlation between price fluctuations and the change in real trading volumes. Therefore, traders should also consider tick volumes.
If we talk about the triple top, volumes usually pick up when the third high has been formed and the price is crossing the support line.
Candlestick chart analysis can also be used to confirm the pattern.
The Japanese candlesticks are believed to be highly informative as they reflect more price data than any other chart formations.
For example, if the double top pattern fails to form and the price moves up again, the triple top may be on its way.
Some certain types of candlesticks or their combinations which indicate a trend reversal can serve as a confirmation of the triple top.
Technical indicators can also back up your chart analysis.
Thus, trend indicators will show gradual exhaustion of the uptrend and its upcoming reversal.
Oscillator indicators help us determine overbought areas during the formation of the triple top pattern. This confirms one more time that bulls are giving up and the price won't be able to reach new highs.
Failed Triple Top
There is no guarantee that a pattern will work out flawlessly every time. A trader needs to promptly detect a failing pattern and take action.
The market itself can give such hints, and we only need to interpret them correctly.
One such warning signal is when lows are formed higher than they are supposed to. In this case, the emerging pattern resembles an ascending triangle.
This means that buyers are ready to push the asset higher, and the price is very likely to continue to move upwards.
Moreover, as soon as the price crosses the support line, stop-loss orders will be triggered which will increase the bullish pressure.
Our second tip is to compare the asset on different time frames.
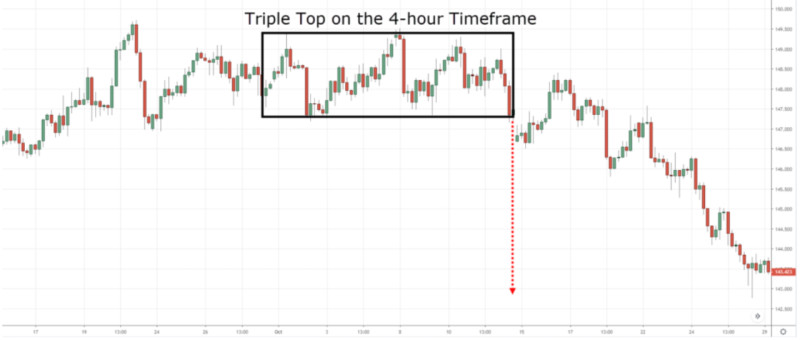
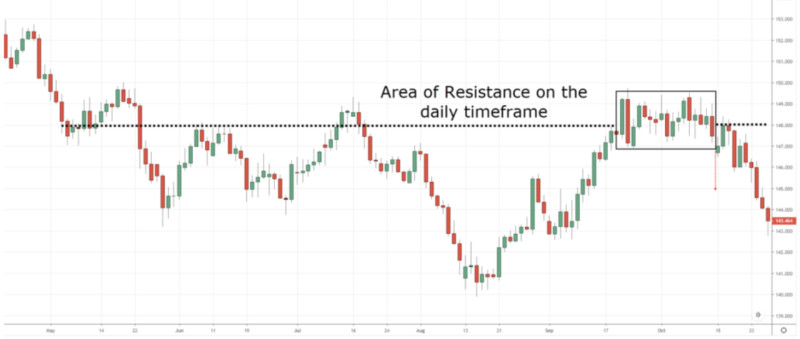
If you see a triple top on the lower time frame but the uptrend continues on the higher one, this means that the bullish trend will likely stay in place.
This approach can be applied to other chart patterns. It is always useful to check the accuracy of the formation on charts with longer time periods.
The explanation is simple: on lower time frames, the asset displays more fluctuations and price noise which can be mistaken for various chart patterns.
When you compare the chart setup on higher time frames, these patterns and fluctuations simply disappear as they have never actually existed.
Pros and cons
Each method of technical analysis has its advantages and disadvantages which is also true for the triple top pattern. Let’s see what they are.
Advantages:
- Highly reliable. If this pattern is confirmed, the entry signal will be safe to follow. For this, you need to wait for the pattern to be complete. In some cases, technical indicators are required.
- Reoccurs in cycles. Since the market moves in cycles, all patterns, including the triple top, tend to reoccur on the chart.
- Easy to trade. If formed correctly, the pattern is very simple to use. The signal to open a trade appears when the price is crossing the support line.
Disadvantages:
- Not very common. As it takes too long for the pattern to form (sometimes more than a month), it is not frequently seen on the charts.
- Can be easily confused with other patterns. At the first stage of the formation, this pattern can look similar to other patterns. If these are reversal patterns, traders have nothing to lose. Yet, if the triple top is confused with continuation patterns, you can lose your entire deposit.
Trading recommendations
To take full advantage of trading with this chart pattern, traders should follow certain rules that we have outlined below.
1. Keep in mind that the process of formation can be rather long. It can take up to one month or more. The longer it forms, the more accurate the pattern is.
2. If you prefer a conservative approach, you need to wait until the pattern is completed. This way, you won’t confuse it with other reversal patterns such as the Double Top and Head and Shoulders. Otherwise, you risk choosing the wrong entry point.
3. Another important thing to consider is the difference between a correction and a potential reversal. The triple top can sometimes look like trend continuation patterns. If you mix them up, you are sure to face losses.
4. Real chart patterns may look different from what you see in the pictures online. Yet, it is better to check that local highs are located at almost the same level with a slight difference of 1-2%.
5. This is a reversal pattern. If you are convinced that the right pattern is being formed, you should close all positions that were opened when the price was moving in a different direction. You will be on the safe side even if the pattern fails to form or turns out to be false.
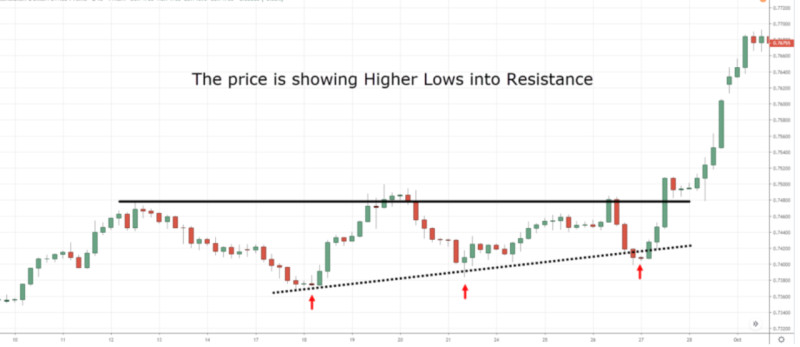
6. Watch for market cues to catch the moment when the pattern is not going to work. For example, higher lows appearing on the chart will serve as such a hint indicating that the uptrend is likely to continue.
7. You should also compare lower and higher time frames when making a decision. If you see a certain pattern on shorter time periods but it does not appear on longer ones, this is very likely a false pattern.
Conclusion
We have discussed a simple and reliable chart pattern - the triple top. Its main disadvantage is that this formation is not very common.
However, if the pattern is formed correctly, the signals it gives are considered rather accurate. Besides, in some strategies, you can open a trade even before the pattern is fully formed or after its formation when a pullback occurs.
Other technical tools such as volume indicators and candlesticks can be used to confirm the pattern.
If the pattern has been formed on the lower time frame, check it again on the higher one. Signals formed on longer time intervals are considered more accurate.
Read more
Triple Bottom Reversal Pattern
Full Guide to Double Top Pattern
Diamond Chart Pattern in Technical Analysis
Full Guide to Head and Shoulders Pattern
Full Guide to Wedge Chart Pattern
Flag Pattern in Technical Analysis
How to use Cup and Handle Chart Pattern
What is a Doji candlestick and how to use it
How to use Pennant Chart Pattern
What is Gap in FX and Stock Trading
What is Dividend Gap and when is it formed
Japanese Candlestick Patterns in Technical Analysis
Full Guide to Double Bottom Pattern


