


Some chart patterns are easy to identify, even with little experience in trading. The Triple Bottom pattern is one of them.
Let’s figure out whether this chart formation is really that simple and what can be the intricacies of working with it.
To learn more about other technical patterns and their use in trading, read the article Full guide to main technical chart patterns.
What is a Triple Bottom
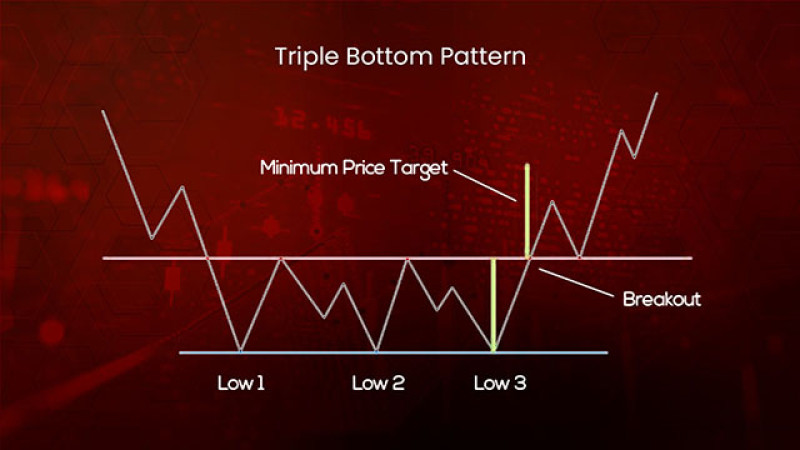
The triple bottom pattern has the shape of three Latin letters “V” following each other. That is why even beginners can easily recognize it on the chart.
This is a reversal pattern signaling the end of the downtrend and the start of the uptrend.
So, apparently, the formation of this pattern should be preceded by a steady downward movement that has been developing for no less than a month or even several months.
It may take up to 1-2 months for a triple bottom to be complete. Therefore, it is better to look for this pattern on higher time frames, for example, on the daily chart.
The pattern is characterized by three consecutive lows formed at almost the same level. The line that connects these lows becomes the support of the pattern.
The pattern also has two swing highs that are reasonably equal to form the resistance line.
The triple bottom pattern is considered complete when the price breaks above the line formed by the two peaks.
Trading volumes should drop when the pattern is being formed, while buying volumes should reach their peak levels as the price breaks above the final resistance line.
After passing the final line, the price may retest it several more times without crossing it. The quote simply rebounds from the resistance and keeps moving up.
Trading with Triple Bottom
You can trade the triple bottom pattern in two ways. One of the strategies is more aggressive while another one is less risky.
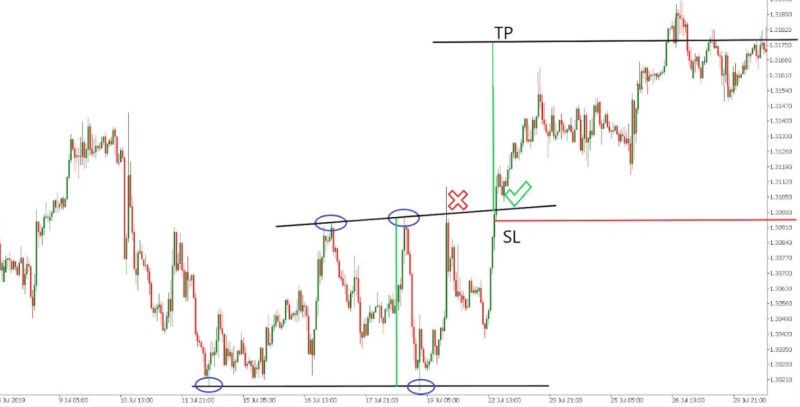
When trading aggressively, you should open a trade at the moment when the price is breaking above the resistance line.
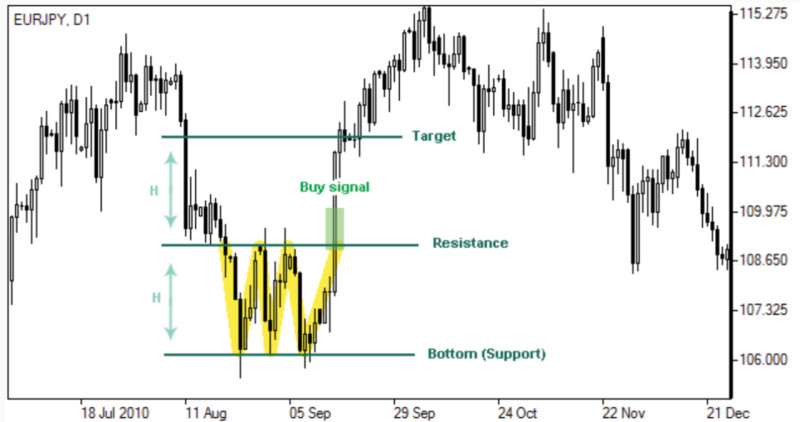
The target in this case should be set at a distance equal to the height of the pattern, that is, the distance between the lows and the highs.
A higher target means more potential profit for the trader.
As a rule, the longer it takes to form the pattern, the stronger the opposite movement will be.
To be on the safe side in case the pattern is false, you can set a stop-loss order just below the resistance line.
Experienced traders use one trick to multiply their profits: they remove the Take Profit set earlier and move the Stop Loss in the direction of the price.
In a more conservative approach, trading on a pullback is used. In this case, you shouldn’t rush to open trades at the moment of a breakout.
You need to wait until the price returns to the resistance line which now acts as new support. The quote then rebounds from this level and continues to move upwards.
You should enter the market with buy positions following this first pullback. Now you can be sure that the pattern has been fully activated.
It is also possible to combine these two strategies: open a trade right after a breakout and then wait for a pullback to open another trade.
Confirming Triple Bottom
Many traders see this pattern as the continuation of the Double Bottom. This means that our pattern emerges when the Double Bottom fails to form.
To learn more about the Double Bottom and other reversal patterns, read our article Full guide to reversal and continuation trend patterns.
So, how do you know what pattern is being formed on the chart? Use additional technical tools for confirmation.
First of all, we have already mentioned trading volumes. So, use volume indicators to confirm the formation of the pattern. Volumes tend to decline throughout the formation process.
However, trading volumes surge rapidly and reach their peak levels as soon as the price breaks through resistance.
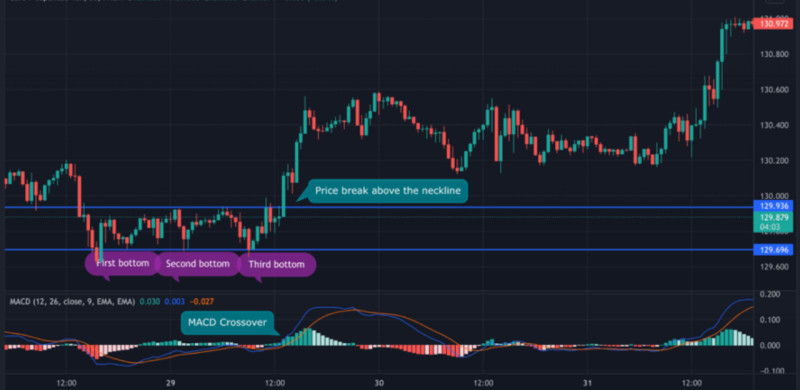
Another method is to combine technical and chart tools. Skilled traders recommend using the MACD indicator as an additional tool.
When the MACD crosses the zero line, it confirms the formation of the pattern.
We have repeatedly mentioned the Japanese candlesticks as the most informative chart patterns.
Sometimes, even one certain type of candlestick can confirm upcoming changes in the trend. The same is true for some candlestick combinations.
A strong signal of an upcoming trend reversal, and, therefore, the formation of the triple bottom, is generated by such candlestick patterns as Dodji, Hammer, Bullish Engulfing, and some others.
Triple Bottom and other patterns
The triple bottom pattern can be confused with other patterns in the process of its formation.
It is very similar to the double bottom pattern but is considered to be more reliable despite being less common.
What makes this pattern so reliable is the fact that the sellers make three attempts to regain control of the price. Yet, they fail to succeed as they face strong support.
This is a clear signal that the current trend is about to reverse.
To be sure that the pattern is accurate and is formed correctly, you should wait until it is fully completed. The final stage of the formation comes when the price breaks through the resistance level.
If you mistake the triple bottom for the double bottom pattern, nothing critical will happen as both these patterns predict a reversal.
When you are waiting for the triple bottom and are looking for the third low to form but the double bottom appears instead, you will simply miss an entry point.
In this case, you may try to trade on a pullback: wait until the price returns to the resistance level to retest it and then rebounds from it to continue the upward movement.
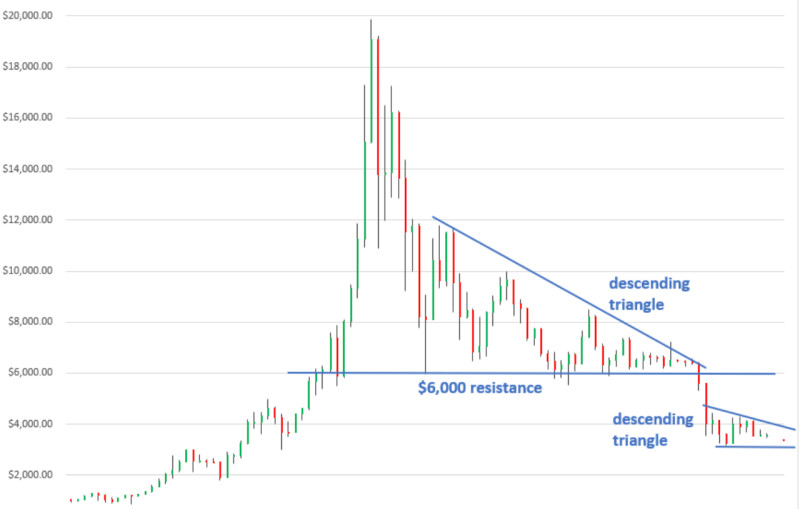
At the same time, traders should be vigilant to not confuse this pattern with a rectangle or a descending triangle as these are trend continuation patterns.
If the consequent high is formed lower than the previous high, this may be a sign of a descending triangle. You should pay attention to such changes.
The second pattern which is similar to the triple bottom is a rectangle. The price enters a correction within this pattern and then simply continues to follow the current trend.
Automated trading
As was mentioned above, the triple bottom can easily be confused with other more common patterns.
Besides, traders can have different views about the formation of any pattern.
Some traders may spot a pattern where others won’t see anything. There are several reasons for this.
First of all, some patterns really look alike in the process of formation. For example, when you see consecutive lows on the chart, this can be either the double or the triple bottom pattern. It can also be a reversed head and shoulders pattern.
Secondly, different traders have their own experience and knowledge of this topic. Traders with more experience can detect patterns more accurately.
To avoid the risk, you should gain enough experience or wait patiently for the pattern to be complete. To be on the safe side, you should open a trade only after full confirmation of the pattern.
However, you may lose precious time and an opportunity to gain maximum profit while waiting for the completion of the pattern. Keep in mind that other traders may enter the market before you and get more profit.
A trading assistant that monitors price changes and identifies chart patterns would be very handy in your case. It will generate signals for opening a trade.
Trading robots, or expert advisors, can help you with this. They are immune to emotional or stress factors and function according to a pre-set algorithm.
In addition to detecting patterns, trading advisors can also open traders if you enable such a function.
The Reversal Patterns Trading is one of such trading programs that can track the formation of reversal patterns, including the triple bottom. What is more, this expert advisor eliminates false signals.
Pros and cons
Each method of technical analysis has its advantages and disadvantages which is also true for the triple bottom pattern. Let’s see what they are.
Advantages:
- Suitable for trading different assets. The triple bottom can be applied to any time frames and trading instruments, including stocks, forex pairs, and cryptocurrencies.
- Easy to use. This pattern is rather easy to spot on the chart. Eleven beginner traders can do this without much effort.
- Reliable. If this pattern is formed correctly, its entry signals are safe to follow. When it becomes clear that the double bottom is failing, the triple bottom is most likely on its way.
Disadvantages:
- Not very common. You don’t come across this pattern too often. Usually, the formation takes the shape of the double bottom and ends there. The triple bottom emerges only when the bears make the third attempt to regain control of the price.
- Can be easily confused with other patterns. This pattern can look similar to other patterns in the process of its formation. For example, the double bottom pattern appears first, and this is where the formation may end. There is nothing wrong with that as both patterns predict a reversal.
Trading recommendations
To trade the pattern effectively, you should stick to certain rules we have outlined below:
1. Gain more experience so that you can easily identify patterns on the chart. The main skill here is to distinguish reversal patterns from trend continuation patterns.
2. To start with, practice detecting patterns by studying the history of quotes. This will allow you to see the main stages of the pattern formation.
3. Use additional tools to distinguish the triple bottom from the double bottom. This way, you will see whether the formation is over or whether the pattern continues to develop.
4. Keep in mind that the triple bottom is considered reliable if it has been developing for a month or more. The longer it takes to form the pattern, the more accurate it is.
5. Manage your risks wisely and don’t use the entire deposit to open one trade. Professional traders open trades with a small lot when the pattern is being formed and then open a trade of a bigger volume after a pullback.
6. Don’t forget to set stop-loss and take-profit orders. As practice shows, in case of a triple bottom, the price goes up to a distance of at least 80% of the pattern’s height. Use this information to place your Take Profit correctly.
7. If you feel confident enough, you may try increasing your gains by removing the Take Profit and shifting the Stop Loss in the direction of the price movements.
8. Signals generated by the triple bottom are considered more reliable when received on higher time frames such as the daily chart.
9. Use other technical analysis tools to confirm the pattern. This could be the MACD indicator, volume indicators, and combinations of Japanese candlesticks.
Conclusion
We have discussed the triple bottom, a reliable chart pattern that predicts a reversal of the downtrend.
Many traders see this pattern as the continuation of the double bottom. Indeed, the formation of the pattern may end with two lows instead of three.
To better distinguish the two patterns, use additional technical tools such as volume indicators or Japanese candlesticks.
When the formation is confirmed, you can enter the market at the moment when the price is breaking through the resistance line. Otherwise, you can wait for a pullback, that is, when the price returns to this level and rebounds from it.
To identify chart patterns more efficiently, consider trading with expert advisors. These trading programs track price fluctuations in real time and look for entry signals.
Read more
Full Guide to Triple Top Pattern
Full Guide to Double Top Pattern
Diamond Chart Pattern in Technical Analysis
Full Guide to Head and Shoulders Pattern
Full Guide to Wedge Chart Pattern
Flag Pattern in Technical Analysis
How to use Cup and Handle Chart Pattern
What is Doji candlestick and how to use it
How to use Pennant Chart Pattern
What is Gap in FX and Stock Trading
What is Dividend Gap and when is it formed?
Japanese Candlestick Patterns in Technical Analysis
Full Guide to Double Bottom Pattern


