


The double top pattern is rather common on technical charts.
Let’s explore the features of this pattern as well as how it is formed and used in trading.
Find out more about other patterns signaling an upcoming reversal or continuation of the trend in the article Full guide to main technical chart patterns.
What is a double top?
A double top predicts the end of the uptrend and the start of the downward movement.
In other words, an asset has reached its highest price and has become overbought, so fewer traders are willing to buy it. As the bearish pressure increases, you can open sell trades as soon as the pattern appears on the chart.
It takes the shape of an “M” letter which makes it easy to spot. However, its shape may not be as distinct as it appears in the pictures found online.
This pattern consists of two local highs and a low between them. The resistance level is formed by these two highs while the support level is found at the low.
For successful trading, it is essential to understand how an accurate pattern is formed.
One important thing to consider is the distance between the tops which should be no less than six candlesticks.
If the peaks are situated too close to each other or the distance between them is too long, then this is not the double top pattern but something else.
Also, the two tops should not necessarily be on the same level. It is even better if the second top is slightly lower than the first one which confirms the accuracy of the pattern.
Usually, this pattern is formed after a steady upward movement in the price.
There is one more key factor that confirms the pattern: the asset’s price should break below the support level. In this case, the pattern is considered complete.
The pattern can emerge in any time frame. However, higher time periods are considered more reliable to spot this formation.
Besides, a double top can be confirmed with other methods, including trade volumes.
Confirming the signal
The formation of a double top means that bulls are giving up and bears are gaining ground.
When buyers are unable to push the price higher after two failed attempts, they form two highs on the chart. At the same time, a low that has been formed in between indicates increasing pressure from the sellers.
After the second failed attempt to continue the uptrend, the price declines below the previous low and changes its direction to the opposite.
To confirm the accuracy of the pattern, traders often use volume indicators.
As a rule, trade volumes increase when the tops of the pattern are being formed and decrease when the bottom appears.
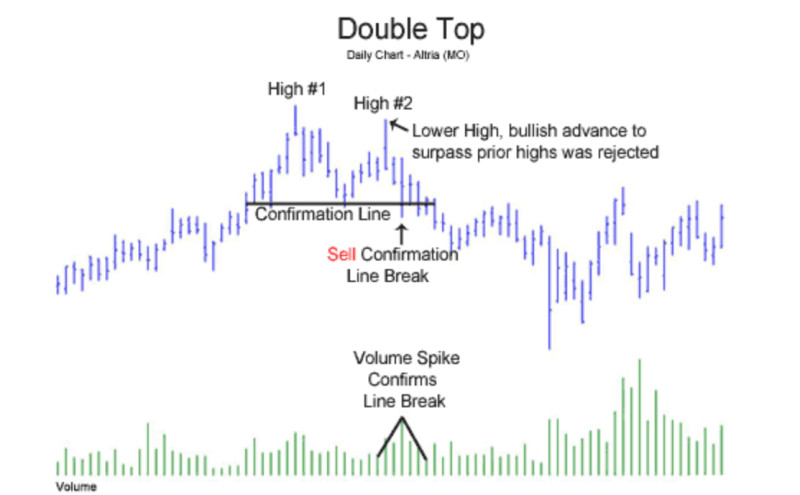
When the formation of the pattern has been fully completed and the price level has broken below the support line, trade volumes usually reach their peak values.
However, this is not the only way to confirm the double top formation. Fibonacci levels and moving averages can also be used for this purpose.
For example, if you add a 20-day moving average to the chart, keep in mind that the price shouldn’t go above the MA if you trade with the double top pattern.
The Japanese candlesticks are believed to be the most informative patterns as they reflect more price data than any other chart formations.
Candlesticks can be different in form and color which means they can serve as signals themselves and indicate a trend continuation or its reversal.
Therefore, when the formation of a double top is accompanied by candlesticks confirming a change in the current trend, this serves as another confirmation of the pattern.
How to trade with a double top
Once you are convinced that the pattern is accurate, you can open trades in accordance with a new trend.
There are two ways to trade with the pattern.
The first one is more aggressive as it implies opening a position at the moment when the price is breaking below the support level.
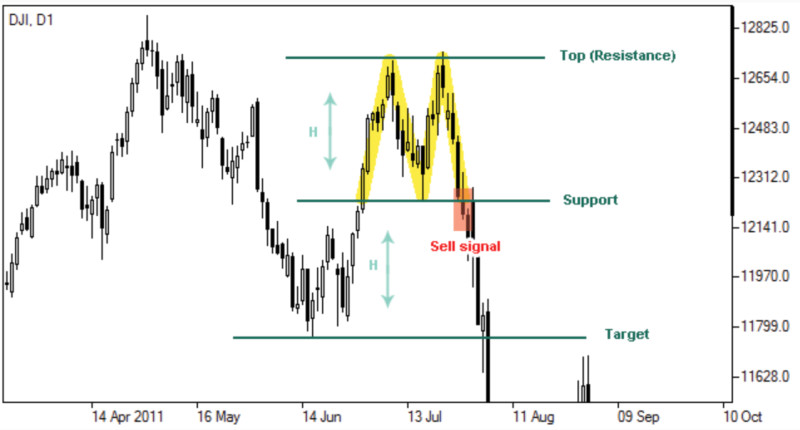
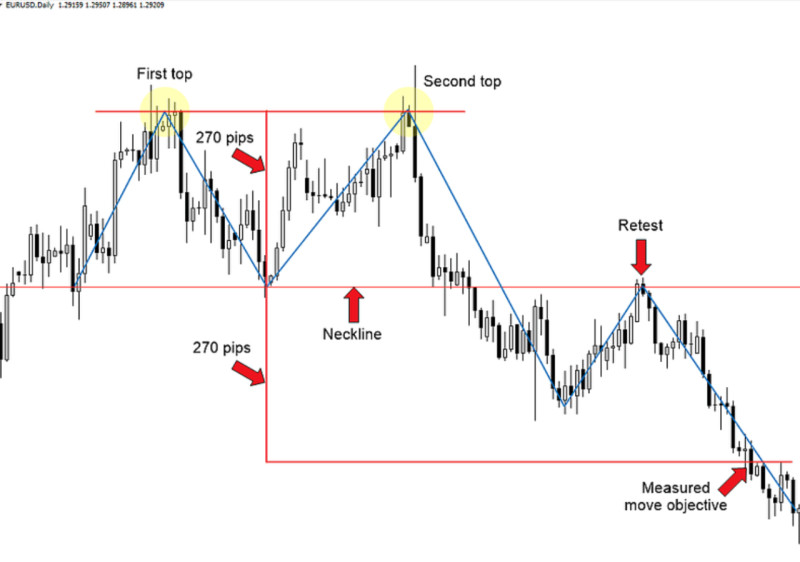
The target level for profit-taking should be determined by a change in the height of the pattern. That is, the target is set at the same distance that is found between the support and resistance lines.
To be on the safe side, you can set a Take Profit at a distance of 60%-80% of the pattern’s height. Make sure it is set at the level of the local peaks.
In a more conservative approach, you should wait until the price passes the support line and then goes back to it.
After retesting this level, the price bounces off it to continue a steady decline. So, positions should be opened at the moment of a rebound.
Trading with a double top also requires the use of an appropriate time frame.
On lower time periods (less than 1 hour), the pattern will reflect more price fluctuations that are mostly market noise.
On higher time frames, such as weekly or monthly charts, the pattern may form for too long thus delaying the signal for opening a trade.
The best time frames for applying the double top pattern are H1, H4, and D1. Some trading platforms have a 2-hour time frame which is also good.
Distinguishing a double top from other patterns
When a double top is being formed, you may easily confuse it with other patterns.
Read the article Full guide to reversal and continuation trend patterns to better understand and detect different types of patterns.
A very similar reversal formation but with an opposite meaning is the double bottom pattern.
The difference between the two lies in the fact that the double bottom predicts a change in the downtrend and its reversal to the upside, while the double top appears when the price is about to decline after an extended advance.
Some traders compare a double top to the Head and Shoulders pattern. However, the latter has three peaks while our pattern has only two.
What makes them similar is that they both precede a reversal in the uptrend.
Another formation that can be sometimes confused with a double top is the triple top pattern. Some traders even view it as the continuation of the double top.
When the two local highs have been formed but the price has not broken below the support line, several scenarios may unfold.
In the first case, it could be a failed double top which means that the asset continues to move higher without a reversal.
In the second case, a double top may develop into a triple top pattern. If so, the trend will eventually reverse downwards.
As we have mentioned earlier, to distinguish a double top from other patterns or from a failed double top, traders should use additional instruments to confirm its accuracy.
All the above-mentioned patterns predict a decline in the price of an asset. Therefore, it is not critical if you confuse these patterns at the start of their formation.
The only danger is that you risk missing the opportunity to open a winning trade if the pattern was wrongly identified. On the other hand, your deposit will stay safe.
Using double top for BTC trading
Crypto traders use different tools of technical analysis on a daily basis.
Technical indicators are among such tools. They are usually applied to the chart or can be used in a separate window. Their main purpose is to help traders identify a possible continuation or reversal of the trend.
Some traders find this method difficult as it implies using various tools on one chart simultaneously.
What is more, you need to monitor changes in each indicator and compare them in order to distinguish false trading signals from accurate ones.
Another popular trading method implies identifying patterns on the chart itself. This approach is based on the idea that the market is moving in cycles, and there is some logic behind the formation of certain patterns, meaning that they occur repeatedly over time.
All that a trader needs to do is monitor the price chart, spot certain patterns, and interpret them correctly. It is essential to accurately identify the exact type of pattern.
The double top pattern is multifunctional and can be used when trading different assets, including cryptocurrencies.
The only thing traders need to keep in mind is that this pattern is much less common in crypto trading than in forex trading.
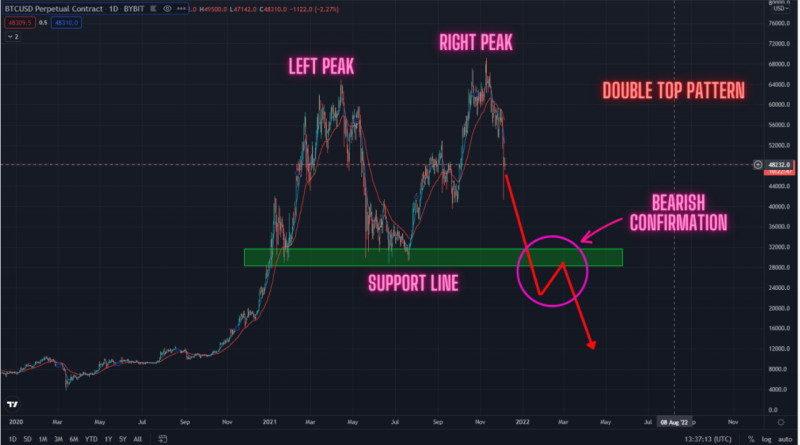
This pattern can be easily applied to bitcoin trading if it appears on the chart and its formation has been confirmed.
However, you need to be cautious when dealing with crypto as bitcoin, like many other cryptocurrencies, is highly volatile and its trajectory can be difficult to predict.
Pros and cons
Each method of technical analysis has its advantages and disadvantages which is also true about the double top pattern. Let’s see what they are.
Advantages:
- Suitable for different assets. The double top pattern can be used when working with different markets, including crypto. Besides, it can be applied on both low and high time frames. However, you should learn how to distinguish false patterns from accurate ones.
- Easy to identify. Even less experienced traders can recognize the pattern on the chart without much effort.
- Easy to trade. When trading with a double top, you choose between two strategies: the first one is more aggressive while the second one is more conservative. Both strategies are profitable depending on the situation.
- Makes it easy to calculate the take-profit level. As was mentioned above, a take-profit order should be set at the distance equal to the height of the pattern itself. The higher the pattern, the more profit it may bring.
Disadvantages:
- Various interpretations. This is a common feature of many patterns as different traders tend to see their formation differently. A lot will depend on a trader and his/her expertise.
- May take a long time to form. The formation of this pattern can continue for a month or more which makes it a very lengthy process.
- It can be easily confused with other patterns. At the stage of the formation, a double top can be mistaken for other reversal patterns, thus stealing the opportunity to open a winning trade.
Trading recommendations
To take full advantage of working with chart patterns, traders should follow certain rules that you will find below.
- Pay attention to the distance between the two tops. The second top should form no earlier than one month since the first one appeared. If the peaks are located too close to each other, this may be a wrong pattern.
- Consider how deep the local low is formed. Ideally, it should be built at a distance of more than 10% from the local high which indicates that bears are accumulating momentum.
- Use additional tools to confirm the accuracy of the pattern and a change in the trend. Such tools include volume indicators, moving averages, Fibonacci levels, etc.
- After breaking above the resistance level, the price should go down by 2-3% and hold there for a while.
- Despite being a widely-used pattern, a double top can be unsuitable for some instruments. For instance, the pattern is less effective when trading low-volatile assets as they tend to form gaps and the formation can be less accurate therefore.
- As a rule, an asset that is more popular among traders has a higher chance of forming an accurate pattern. Therefore, it is better to choose the most traded currency pairs on Forex to apply the double top pattern.
- To get a clear confirmation of the pattern, wait until the price breaks below the support line. Otherwise, it could be a failed double top even if two peaks have been formed on the chart.
8. A Take Profit should be set at a distance equal to the height of the pattern itself, that is, the distance between the upper and the lower boundaries of the pattern. In a more conservative approach, set a Take Profit at a distance of 60%-80% of the pattern’s height. A Stop Loss should be set at the local lows of the pattern.
Conclusion
In this article, we have discussed the main features of the double top pattern. This formation is multifunctional and very common and can be applied to different charts.
However, its formation may take more than a month which can be a big disadvantage. Besides, a failed double top brings no change in the trend.
Moreover, this pattern can be easily confused with other reversal patterns at the initial stage of the formation. Yet, it is not critical as most of the patterns predict a reversal.
It is advisable to use various tools to confirm the accuracy of the pattern. Such tools include technical indicators and candlesticks.
Patterns formed on medium-term charts of popular trading instruments give more accurate signals. A more popular instrument is more likely to form a correct pattern.
Read more
Triple Bottom Reversal Pattern
Diamond Chart Pattern in Technical Analysis
Full Guide to Head and Shoulders Pattern
Full Guide to Wedge Chart Pattern
Flag Pattern in Technical Analysis
How to use Cup and Handle Chart Pattern
What is a Doji candlestick and how to use it
How to use Pennant Chart Pattern
What is Gap in FX and Stock Trading
What is Dividend Gap and when is it formed?
Japanese Candlestick Patterns in Technical Analysis


