


To make your trading profitable and upgrade your trading skills to a new level, you can use various chart patterns. For better understanding of patterns diversity, read the article Technical analysis patterns.
In this artcile, we focus on the diamond formation, its key features, and how to trade with its help. We will describe how to properly organize the trading process while applying to this pattern and using all its advantages.
Interpretation and a shape
The diamond pattern is a type of graphic formations that are used in technical analysis. It belongs to the category of classic ones, but it rarely appears on asset charts in the process of trading.
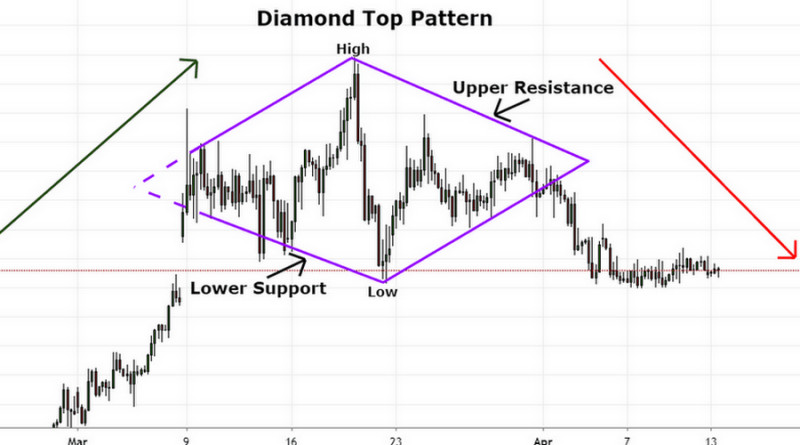
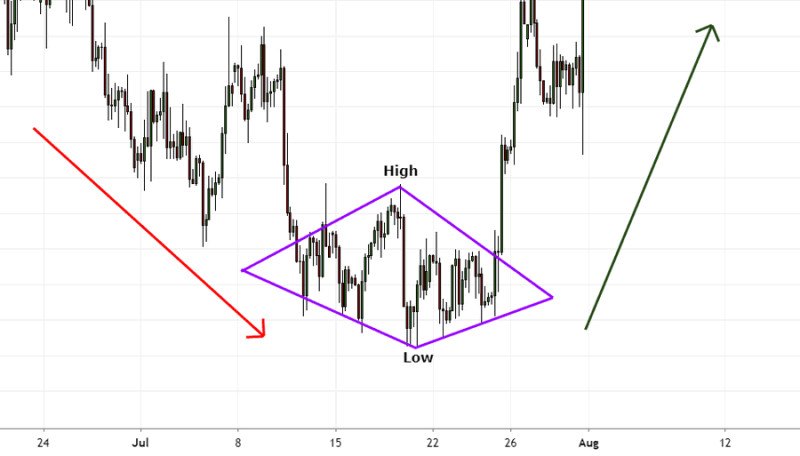
The diamond formation looks like two triangles connected to each other by one of the sides. First, a diverging triangle is formed on a chart, followed by a converging one.
The diamond formation is based on support and resistance lines that are parallel to each other in most cases. That is, the support line of the first part of the pattern is parallel to the resistance line of the second element, while the resistance level of the first part is parallel to the support level of the second one.
However, this is a property of an ideal figure that appears very rarely.
The pattern resembles a gem of the same name, which is why it is called "a diamond". This formation is also sometimes called "crystal" or "rhombus".
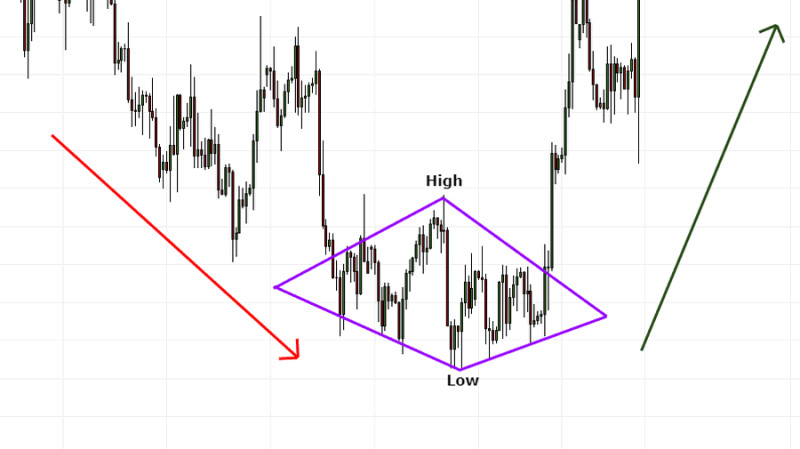
The key feature of the pattern is that it can appear in both an uptrend and a downtrend. In most cases, it signals that the main trend has approached the peak of an uptrend or the bottom of a downtrend in trading.
It means that a trend direction may reverse.
Types of the diamond formation:
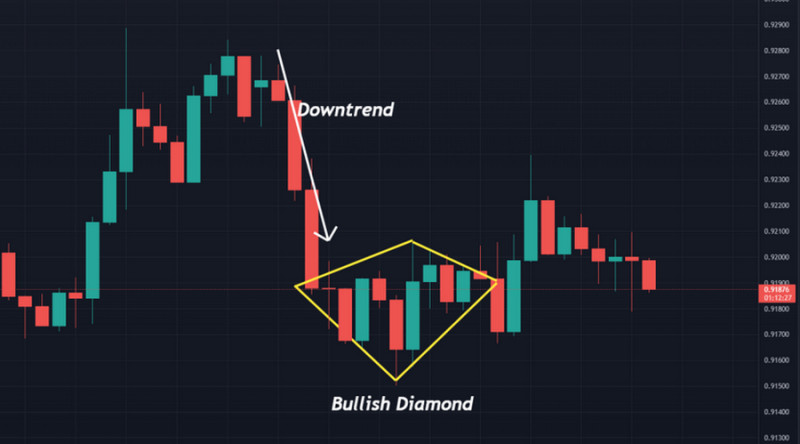
1. The bullish diamond appears after a decline and signals that the market may turn to the upside.
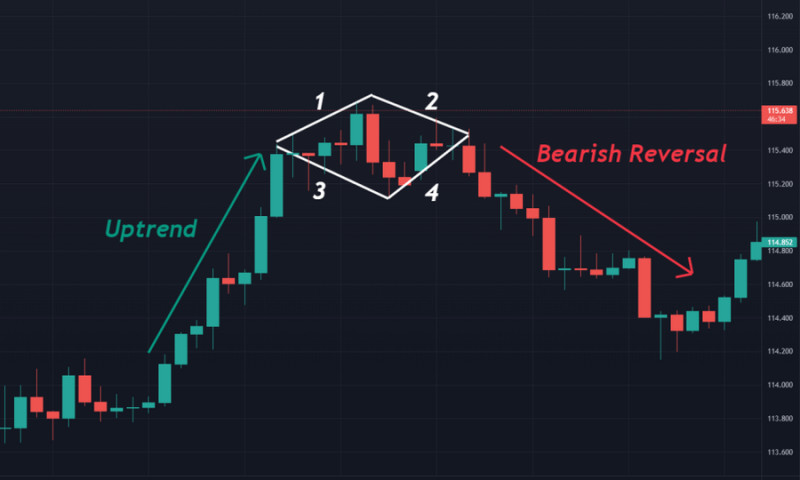
2. The bearish diamond signals a reversal in an upward trend to a downside one.
It means that the diamond formation belongs to the category of reversal patterns. However, a trend is not always broken, and the further direction depends on the timeframe used in trading.
The older the timeframe, the higher the chance of a reversal.
Specific features of the diamond formation:
- It appears during a definite trend, either a growing or a falling one. There is no point in trying to identify the pattern in a flat market.
- In most cases, the pattern signals a reversal, but sometimes, the current dynamics continues or a period of correction begins. As a rule, the underlying trend continues if the diamond appears in short time frames such as four hours and lower.
- The pattern is difficult to identify on charts of most assets. The frequency depends on the volatility: the higher the volatility, the more likely this pattern to be formed.
- The reliability of the signal is higher on bigger timeframes. Practice shows that patterns appearing on timeframes smaller than H4 are not reliable. The best option is to use daily and older timeframes.
- A pattern during an upward trend is formed faster than during a downward one. In addition, in the first case, it has a larger range of price changes than in the second one.
- An ideal pattern is one in which the period of price increase is equal to the period of its decrease, while the support and resistance lines are parallel to each other. But these conditions do not appear really often.
In most cases, the actual values on charts deviate from standard ones. But the closer the outlines of the figure to the standard, the more reliable signals it provides.
If a trader is aware of the above peculiarities, then they will be able to interpret this pattern correctly.
Formation
The pattern formation begins at the moment when an asset price makes a rapid move in the direction of the underlying trend. If a trend is bullish, there is an upside swing, and in a bearish trend a swing is downside.
After that, the momemum becomes weaker, and the price action slows down.
Next, volatility increases, and the first part of the pattern is formed. In this period, the distance between the extremes is constantly growing.
Following that, the price range narrows again, and the main part of the pattern is formed.
When bulls or bears become unable to maintain a profitable price for them, a price goes beyond the pattern, and a breakout occurs.
If this situation is observed on a daily chart, then the initial vector changes to the opposite one after a breakout. In the case of shorter periods, the trend may continue even after the pattern formation.
At the same time, it is important to understand that the diamond can be used to determine not only the vector of price changes, but also the length of the future trend. To find out to what level the price will rise or fall after a breakout, many traders use the following algorithm:
- Calculate the distance between a peak and a bottom of the pattern. It refers to a segment connecting the highest and lowest prices.
- This distance is plotted between the points of levels intersection: upwards if there is a bullish reversal, and downwards if it is bearish.
Some traders prefer using not a vertical diagonal of the diamond, but the trend length before the formation of the pattern.
So, the use of this pattern in technical analysis solves two problems for traders:
- it helps to predict a trend reversal, choose the optimal entry point and the direction of a trade;
- предусмотреть потенциальную прибыль исходя из прогнозной стоимости актива после пробоя. provide for potential profit based on the forecast value of the asset after the breakdown.
Identification
It is quite difficult to find the diamond pattern on a chart. It is an especially challenging task for beginning traders who lack experience in using chart patterns. Besides, the market situation does not alway indicate the formation of this pattern.
To identify the pattern, first you need to make sure that there is a definite trend on the market. Next, you need to find the diverging and converging triangles on a chart.
To make the things easier, you can follow these recommendations:
- When a price starts fluctuating following a clear trend, forming highs and lows in turn, it is necessary to fix the resulting extremes.
- Connect peaks and bottoms. The resulting segments will be the guide lines of the first part of the pattern, a diverging triangle.
- When the range begins to narrow, you also need to connect the extremes. They will become sides of a converging triangle.
When identifying the pattern, you need to pay attention to the following factors:
- In the center of the diamond, the price makes a strong breakthrough, after which it begins to fall gradually. At this moment, the formation of the divergent part of the model is completed and the formation of the convergent part begins.
- each of the triangles may have a different number of price fluctuations, but the more there are fluctuations in the first part, the more likely the diamond to be formed.
At the same time, it is important to remember that if a pattern has all the features of the diamond, but it is formed on short time frames, a reversal is unlikely to occur. In such a case, the current dynamics continues or the market turns flat.
How to trade the diamond pattern
As already mentioned, the diamond pattern is usually formed either at the peak of an uptrend or at the bottom of a downtrend. In the first case, sell trades are reasonable while the second case signals selling opportunities.
The entry point is determined upon a breakout when the price crosses the support or resistance line and moves in the direction opposite to the original vector.
It is not reasonable to open trades inside the pattern. If the diamond formation has not completed, but there is every indication that it is being formed, then you'd better wait for its completion.
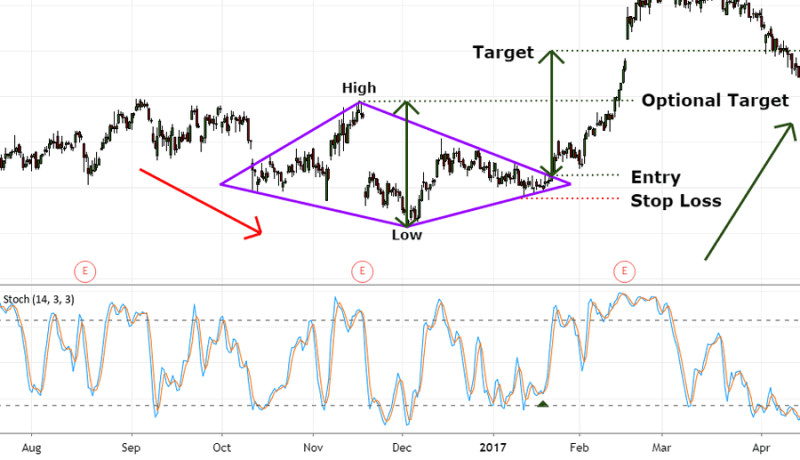
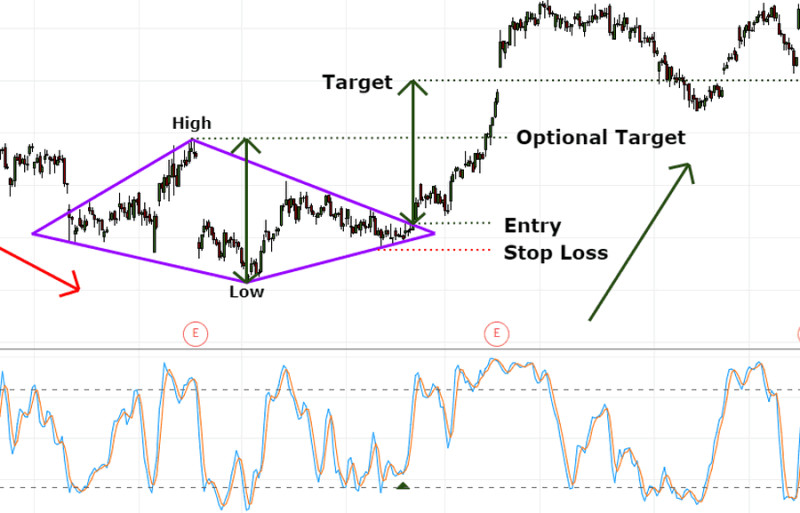
Another option is to confirm the upcoming reversal using additional tools. For example, you can use a Stochastic Oscillator that shows a change in momentum before a breakout, as shown in the chart.
Other additional tools may be MACD, Moving Average, or classical support and resistance levels.
Let's consider several options for placing a position after a breakdown. After all, this strategy is the most optimal in terms of the risk-reward ratio in trading. Besides, most traders use this technique.
You can enter the market upon identifying the diamond pattern:
1. Right after a breakout. To rule out a false breakout, you can wait for confirmation, that is the candle should close outside the pattern.
At the same time, you should remember that a bullish pattern implies that levels should cross from the bottom up. In this case, we are talking about a break of a local resistance level.
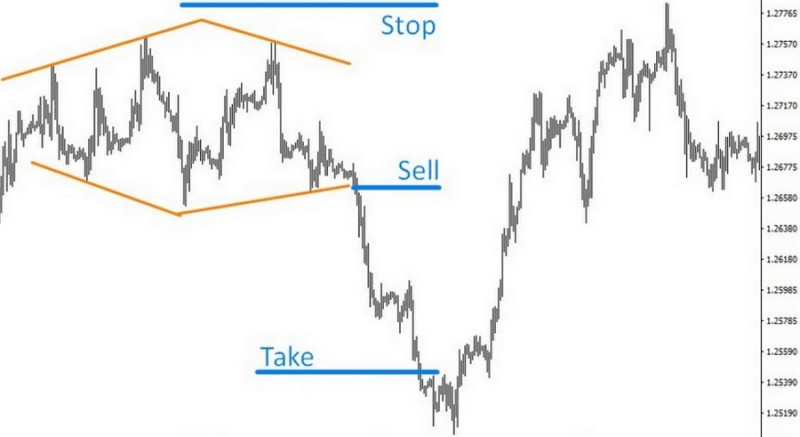
In the case of a bearish diamond pattern, the price line crosses a support level and continues falling.
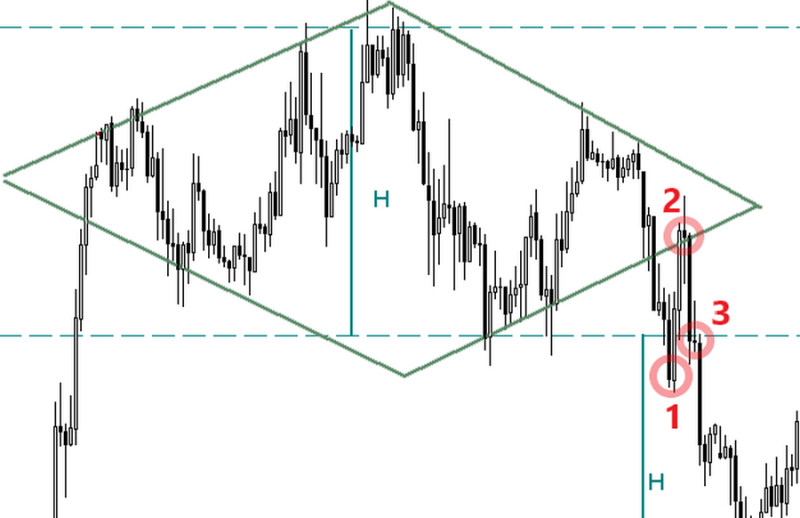
To set a Stop Loss and Take Profit, use the diamond's diagonal. This is a distance between the pattern high and low fixed inside it. The diagonal should be plotted from the breakout point.
In a bearish formation, Take Profit should be set below Stop Loss, and in a bullish one, it is vice versa.
On the chart below, there is an example of an entry point and placement of limit orders in the bearish conditions.
Remarkably, some traders use not the entire diagonal but three quarters of it to determine target levels.
2. After the level retest. Quite often, quotes return to the crossed line after a breakout, and then bounce off it again.
This is a retest. It helps traders to determine the optimal entry points. The Stop Loss and Take Profit levels are set in the same way as described in the previous strategy.
It is important to note however, that retests sometimes do not happen at all. It means that if you follow this strategy, you may simply miss an opportunity to open a trade.
To resolve this dilemma, experienced traders recommend placing two orders. One of them is set in accordance with the first strategy, while the second is placed upon a retest.
3. After a break of a price low or high formed inside the pattern. In the bullish version, a stop loss should be placed below the nearest low or below the pattern bottom. A take profit should be placed at a distance of a diagonal plotted upwards from the breakout point.
If the pattern is bearish, then the limit orders should be placed in inversed manner.
When choosing a trading strategy, it is important to pay attention to the shape of the diamond. We will explain what features can be noticed and how to respond to them.
- A different number of waves in the left and right parts of the pattern. In this case, traders should open positions only after a breakout, focusing on a retest as a confirmation of a reversal.
- The first and second elements are formed during different periods. This is considered a normal situation, so traders use it as a signal to enter the market either after a breakour or after a retest.
- The price breaks out of the pattern borders, that is breaks a support or resistance line. In such a case, traders can plot new levels, wait for a break, and open a trade after a retest.
Now let's focus on limit orders.
Experienced traders do not recommend placing a stop loss too close to a breakout point. One option is to set it outside the pattern, that is, set it above the high if the pattern is bearish or below the low if it is bullish.
In such a way, traders can insure themselves from exiting the market during price fluctuations.
The second option implies setting a stop loss above the high or below the low of the last price swings but not the pattern itself.
As for a take profit, there are also two options:
- Use the diamond diagonal which is the distance between breakout points. In most cases, it is a line that appears in the center of the pattern and indicates the completion of the formation of a divergent triangle.
2. Use the trend length preceding the pattern formation. Such a method is applied if the diamond diagonal is much shorter than a trend range.
It happens when a strong trend is formed amid significant economic events or news. And when the pattern formed, their influence on prices decreases.
In this case, a part or the entire length of the trend is used to set a take profit.
To keep abreast of important economic news and events, you can the Economic Calendar by InstaForex.
It is also important to note that trading this pattern is characterized by wide stop loss orders. This is due to the fact that the pattern itself is quite big.
Similarly, take profit levels are also set at a significant distance which is even bigger than in the case with a stop loss. Many traders believe that an optimal stop loss-take profit ratio is 1:2.
Pros and Cons
Every technical analysis tool has its advantages and drawbacks that can be noticed during trading. You can learn more about the most popular pattern in the article Full Guide to Trend Reversal and Continuation Patterns.
In this article, we will focus on advantages and drawbacks of the diamond pattern.
The advantages of the pattern are:
- It helps traders find entry and exit points.
- Patterns on bigger time frames are considered more reliable and may help traders get hefty profits.
- It is effective in implementing reversal strategies.
The diamond drawbacks:
- It can be rarely seen on charts, especially on big time frames.
- It does not provide reliable reversal signals when applied on short time frames.
- It is difficult to identify, especially for beginners.
Notably, on daily and older time frames, the formation of the diamond pattern can take several months. This property can also be considered as a drawback. At the same time, such patterns are of a high degree of reliability.
On short time frames, the pattern is formed faster, and its signal can be received in a few candles. But in this case, the reliability of the received signals is questionable.
We also want to draw your attention to the fact that beginning traders quite often compare this pattern with the Head and Shoulders formation. Visually they are very similar indeed.
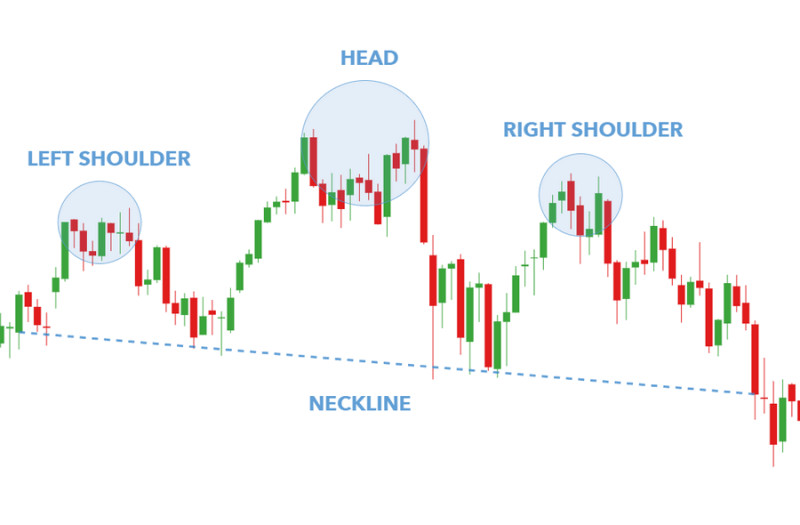
However, during the formation of the diamond pattern, price fluctuations lead to the formation of triangles. Besides, it is impossible to plot the so-called neck line.
Conclusion
The diamond is a rare but quite a reliable reversal pattern that can be used in trading. It is important to remember though that this pattern may provide false signals on smaller time frames, so traders are better to avoid opening deals based on such signals.
Before you start trading, you need to make sure that there is a definite trend, either bullish and a bearish one. Additionally, you should wait for the pattern to complete. The most optimal entry moment is a breakout of a support or resistance level.
If you have carefully read our article, then setting limit orders during trading will not be difficult for you. The main thing is to correctly correlate potential profit with possible risks.
For beginners, the use of the diamond pattern in trading and identifying may seem complicated. However, this problem is solved by training.
Beginners can learn how to trade using the diamond pattern on a demo account opened with InstaForex. In this case, the risks will be zero, because trading is carried out with virtual money.
To trade with real money, you need to register a real account. With InstaForex, you can choose the most suitable solution by analyzing the trading conditions of each of the offered types of accounts.
You may like:
Full Guide to Triple Top Pattern
Full Guide to Triple Bottom Pattern
Full Guide to Double Top Pattern
Full Guide to Head and Shoulders Pattern
Flag Pattern in Technical Analysis
Cup with Handle Pattern: Use Cases and Interpretation
Doji Candle: What is it and How to Use?
Gap Trading on Forex and Stock Exchange
Dividend Gap: Simple Explanation


