


Patterns help traders not to miss the best moments to open and close trades, as well as inform them about the situation in the market. You can learn more about this in the article Technical Analysis Patterns.
In this article, we will focus on the head and shoulders pattern. We explain how this pattern looks on the chart, what it warns traders about, and how to use it correctly in trading.
Understanding pattern
The head and shoulders pattern stands out from the variety of technical analysis patterns for its informative and practical nature. In the community of traders, it is very popular and belongs to the category of classical patterns.
This pattern appears during a bullish trend and indicates that the trend is likely to change. That is, this pattern is categorized as a reversal pattern.
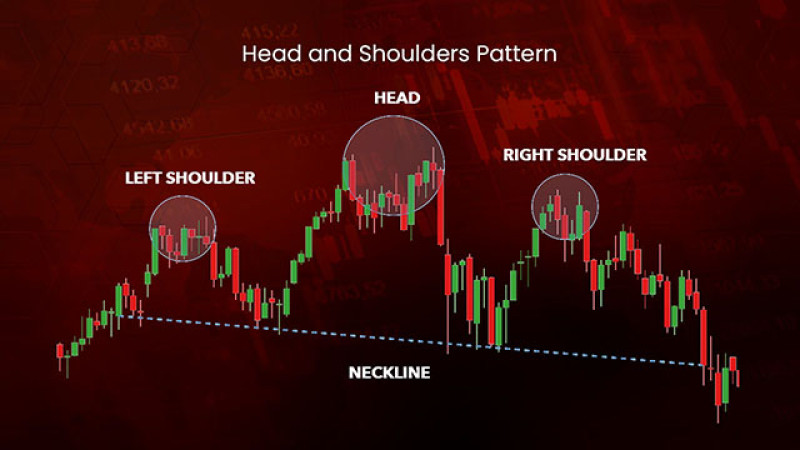
On the chart, the pattern represents three waves that appear one after another:
- the middle wave is called a head and indicates bullish market sentiment. At its top, the highest value of the asset is fixed, respectively, this wave has the greatest height;
- the waves located on both sides of the head are shoulders. Most often, their height is approximately the same, but symmetry is not a must. At the same time, as we have already mentioned, the top of each is below the top of the head.
During its movement within the pattern, the price, forming these waves, rests on the so-called neckline. In this case, it is a support level.
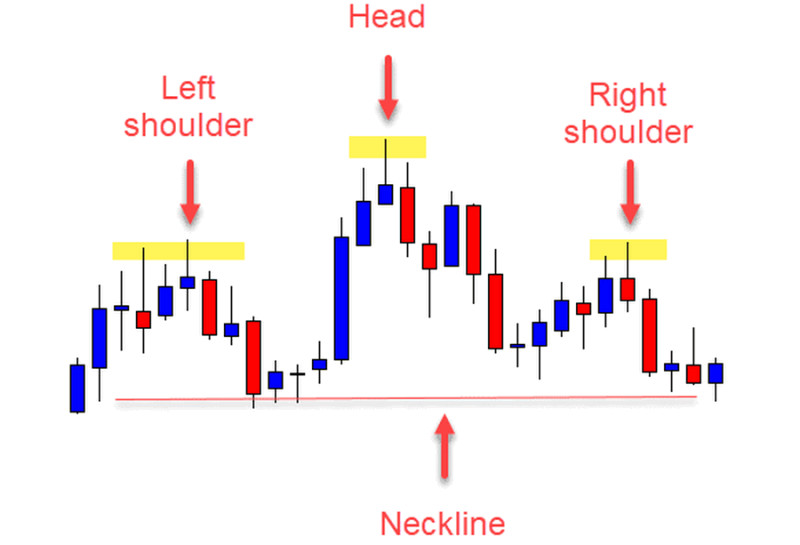
If you look at the picture above, you can see that the pattern resembles the outlines of a person’s portrait. That is why the pattern got such a name.
Meanwhile, the most interesting and important thing happens at the end of the pattern’s formation. When the right shoulder is completed, the price pierces the neckline and plummets below it.
It is the moment of moving from top to bottom that confirms that the formation of the pattern is complete.
After that, a bearish trend begins in the market, and the neckline becomes a resistance level.
Each part of the pattern begins and ends, touching its base.
Importantly, there are no strict requirements for the height, width, and ratio of parts of the pattern to each other. The main thing is that the head should be higher than other parts of the pattern.
As a rule, the big height and width of the pattern indicate a considerable strength of the movement after the breakthrough. That is, the larger the pattern is, the steeper the price drops after the reversal.
The pattern is popular due to its practicality and relative simplicity. In addition, it applies to a wide range of assets.
The pattern is used:
- on forex;
- on cryptocurrency exchanges;
- in stock markets, etc.
Thomas Bulkowski and Gene Savin, famous researchers, proved the effectiveness of the pattern in their studies.
Their study revealed that:
- a bearish reversal occurred after the appearance of the pattern in 93% of cases;
- the price of the studied assets after the breakthrough decreased by more than 20%;
- the bearish trend after the breakthrough lasted three months on average. In this case, we are talking about the value of stocks. On Forex, this period is usually shorter.
Pattern on chart
Let's analyze how the head and shoulders pattern is formed on the USD/CHF pair chart.
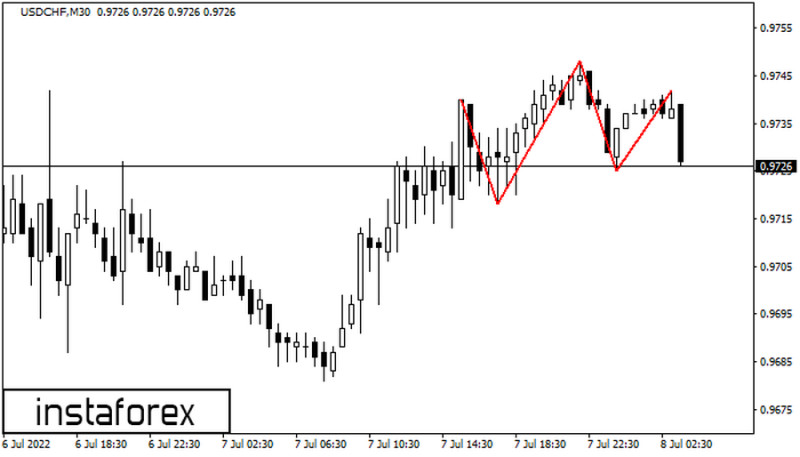
The chart shows that the pattern was preceded by an uptrend. After that, the price reaches a high of 0.9742.
This high is the left shoulder of the pattern.
After that, the price goes down and then rushes up again. The head is formed at a new high of 0.9750.
Then the chart shows that the price decreases and moves upward again. The right shoulder is formed approximately at the level of the left shoulder.
At this point, the uptrend is highly unlikely to happen and the quotes go below the support level. In other words, a bearish reversal occurs, which is what the pattern warned us about.
All fluctuations in the price depend on supply and demand, let's talk about how active sellers and buyers are at each stage.
Let's do this by analyzing the trading volume.
- When the price rushes to the first high, the volume increases. This is due to the fact that market participants become more active;
- On the segment between the left shoulder and the head, this indicator most often decreases. We are talking about the distance between the base and the peak of the head;
- When the price goes down from the head to the next low and then soars to the peak of the right shoulder, the volume is low most of the time;
- The next time the indicator rises sharply after the breakthrough. One should to pay attention to this when trading.
Thus, the volume shows that bulls lack the potential to maintain the uptrend. As a result, bears seize the initiative and set the price’s direction.
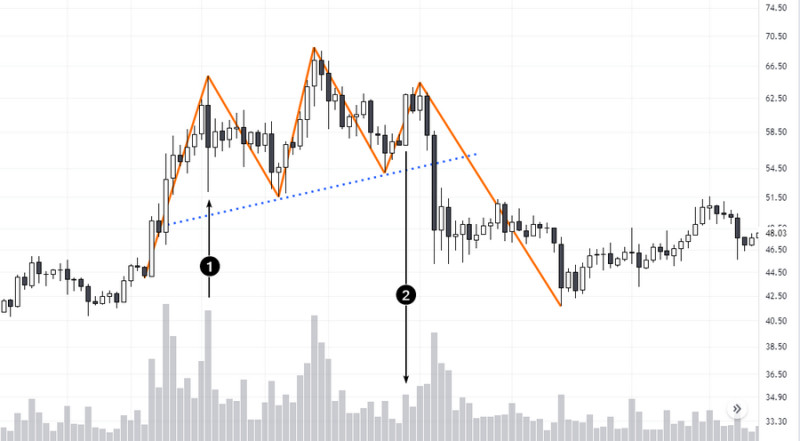
Important features of the pattern:
- a trend. If we are talking about a standard pattern, the trend should be upward.
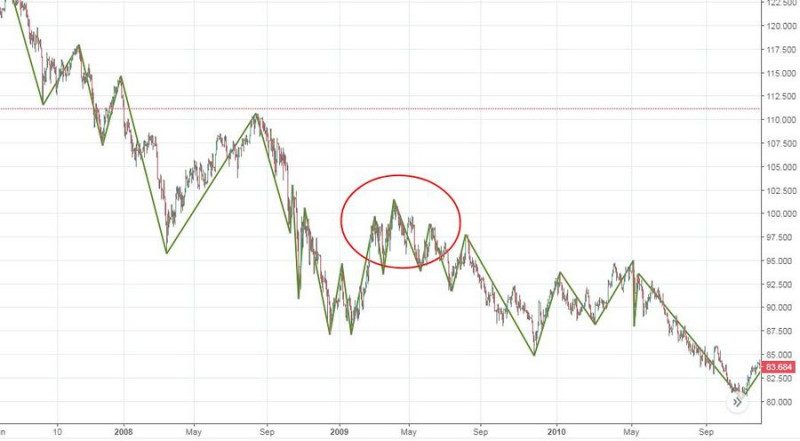
The chart below does not show a bullish trend. Notably, the pattern looks like the head and shoulders one but you should not trust its signal.
In a bear market, an inverted version of the pattern appears, which we will talk about below. As a rule, the longer the trend lasts, the stronger a reversal is;
- test of the support level. Within the pattern, the price attempts to break through the support level, and it does eventually;
- support becomes resistance. This occurs after a breakthrough when a previously formed bullish trend becomes bearish;
- increase in trading volumes before and after the breakthrough. This is when bears are controlling the market and pushing the price down;
- the head above the shoulders. This pattern indicates that bulls lose their strength in the market, and the activity of bears contributes to the price decrease.
At the same time, the position of the right shoulder below the left shoulder indicates that the pattern is of higher importance;
- the reliability of the pattern, which depends on the time frame. The higher it is, the more reliable the pattern is.
Usually, remembering all the features of the pattern is difficult, especially for beginners. After some practice, the pattern becomes easier to identify.
For professional traders, it does not cause any problems to find it on the chart.
How to trade
We have already told that the head and shoulders pattern in the bull market warns the trader that the upward trend will be replaced by a downward one. It means that short positions will be a priority.
As a rule, it is better to open them after a breakthrough. However, this also applies to most other patterns that are used in technical analysis.
If you enter the market early, the result can be unpredictable. Usually, beginners make this mistake.
One should know that the pattern is considered complete only after a breakthrough. Only in this case, it is possible to predict the reversal, and the risks when making transactions will be minimal.
Although there are traders who wish to gain heftier profits against higher risks.
Styles of trading with the head and shoulders pattern:
- The classic style provides for the opening of short positions after the break of the neckline. An important entry condition is an increase in volume during the formation of a breakout candlestick;
- The aggressive style assumes a much earlier entrance - after the last high within the right shoulder has appeared on the chart. In this case, there is a probability of getting much more profit but the risks are also high;
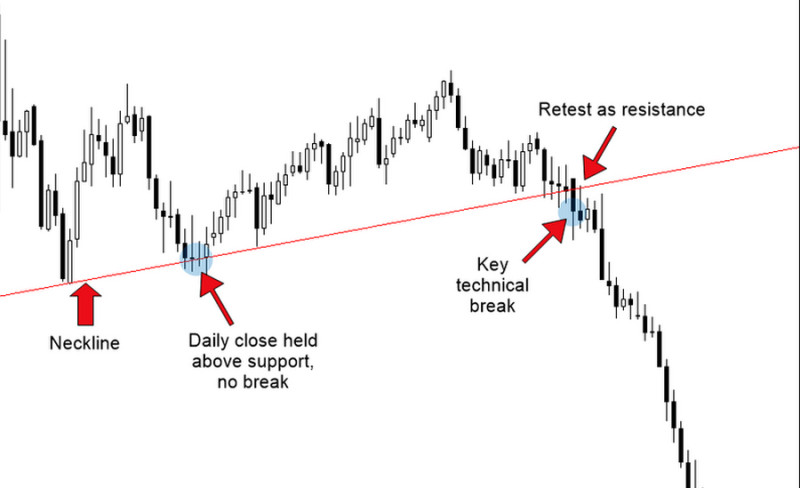
- The conservative style is based on opening a position after the level is confirmed by the value after the breakthrough. Simply put, a trade is opened when the retest of the line, which has turned from support to resistance, has occurred.
If the price bounces from it, it signals that the bearish trend has really established in the market.
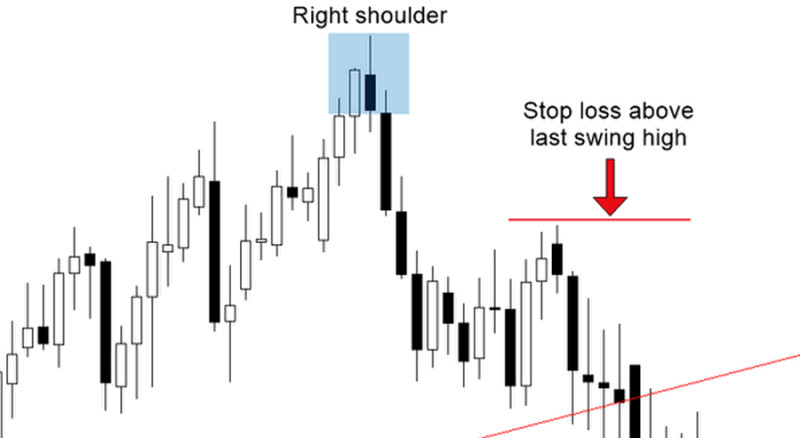
Let's focus on the most common technique in more detail, when a short position is opened after the break of the neckline. In this case, a trader needs to do the following:
- it is necessary to wait for the closing of the candlestick below the support line;
- a stop-loss order should be placed above the high of the right shoulder;
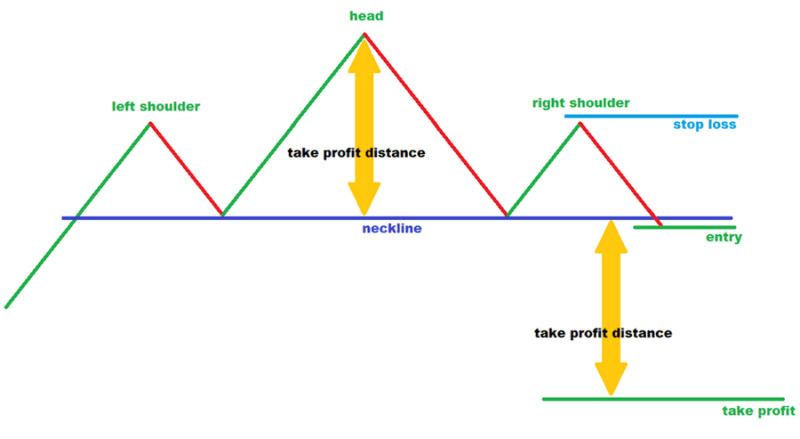
- it is better to place a take-profit order below the breakout point. The top of the head to the neckline is used to determine the optimal distance.
In the picture, you can see how this technique is implemented.
Notably, one can use both pending orders and market orders. In the first case, a trader does not need to monitor the quotes and devote a lot of time to trading.
A sell order is placed slightly below the neckline. In this case, a false breakout may be formed, which is likely to lead to financial losses.
The second option requires more time and detailed analysis but it develops important trading skills. In addition, there is an opportunity to correct your actions in case of force majeure.
Head and shoulders pattern in trading: Confirmation
Despite the fact that the pattern provides effective and highly accurate signals, it does not give a guarantee that the trade will be successful. After all, markets are inherently unpredictable, and there is always a probability that the forecast will not come true.
Traders cannot predict some factors that can influence the quotes. However, there are also clearly seen factors that should be taken into account when trading.
On the chart below, you can find the head and shoulders pattern. Contrary to the fact that it is a bearish reversal pattern, the price moves up after the break of the neckline.
In this case, traders who opened short positions will bear losses.
Why did this happen? There are two nuances that should have warned traders:
- There is no distinct upward movement before the beginning of the pattern. This calls into question the reliability of the signal;
- The support level shows its strength when a break should have been expected. As a result, the efforts of bears to push the price down are failing.
It is necessary to follow certain recommendations in order to avoid opening positions by false signals. Here are the main ones.
Before opening a trade using the head and shoulders pattern, it is necessary to:
- make sure that there is a bullish trend;
- analyze the trading volume. We have already described how to do it in our article;
- use additional technical analysis tools: Moving Averages, Stochastic Oscillators, and Fibonacci levels. For example, if the latter indicator shows a pullback from the highs by more than half of the distance, it means that the bullish trend is exhausting.
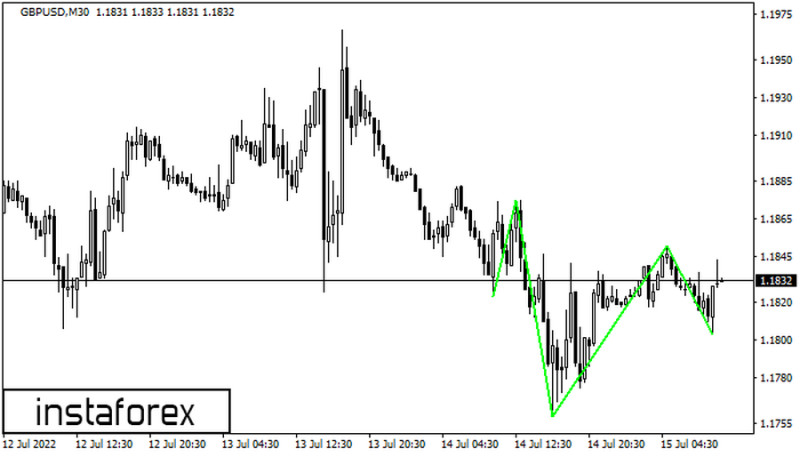
Inverse head and shoulders pattern
The inverse pattern is the opposite of the standard pattern, which we discussed in the first part of our article. In contrast, the inverted pattern appears in downtrends.
It consists of the same three peaks but they are inverted. Accordingly, the peaks become troughs.
The inverse head and shoulders pattern is shown in the screenshot below. Points 1 and 3 represent the left and right shoulders, point 2 shows the head, and point 4 indicates the neckline.
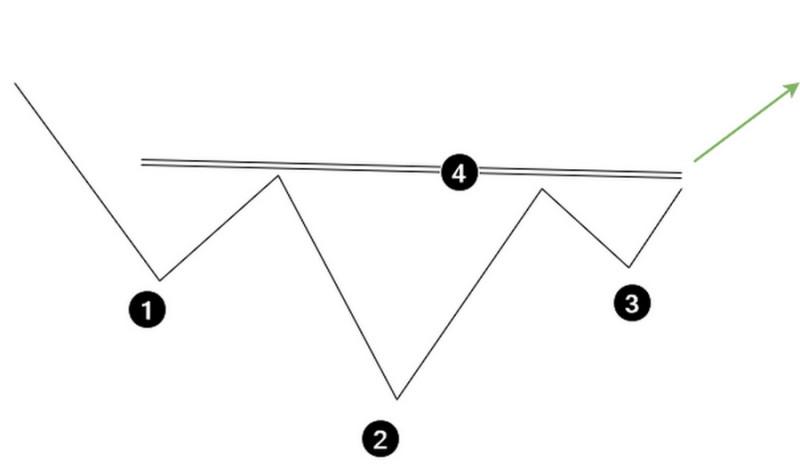
This pattern also signals a trend reversal, that is, it warns traders that the bearish trend will change to a bullish one.
On the chart, the pattern is quite rarely formed perfectly. More often, you can find such patterns with small deviations from the standard model.
Nevertheless, the main condition should be fulfilled. The head should be located below both shoulders. That is, the lowest value of the asset is fixed exactly in this part of the pattern.
Like other patterns of technical analysis, the inverted version of the head and shoulders pattern reflects the confrontation that occurs in the market between bulls and bears.
In this case, the following stages can be observed:
- The first trough and the subsequent rise demonstrate waning bearish momentum;
- To maintain the downtrend, bears try to push the price below the initial bottom. They succeed;
- Then the price increases and right after that it goes back down;
- The price is unable to fall below the previous low. This signals that bulls outperformed bears;
- Finally, bulls take control of the market. They drag the price higher and finish the reversal.
Trading
The head and shoulders pattern in the bear market indicates a bullish reversal. That is, when the inverted pattern appears on the chart, we should expect the uptrend should replace the downtrend.
This means that it is the right time to buy the asset as its price will rise.
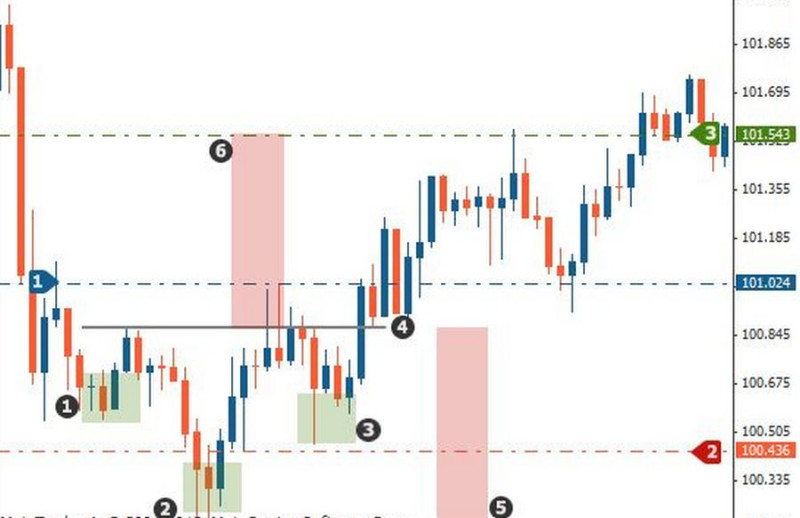
Here are two possible options for opening long positions.
The first strategy involves entering the market after the price breaks the neckline. To rule out the possibility of a false breakout, you can wait until the candlestick closes above the level.
It is better to place a stop-loss order below the right shoulder.
You can use the height of the pattern to determine the potential profit, that is, the distance from the bottom point of the head to the neckline. The line should be drawn upwards from the breakpoint.
In the screenshot, the stop-loss order is marked with a red line and the take-profit order with a green one.
The second strategy is based on a retest of a broken level. That is, the price should bounce up from the line, which has turned from resistance to support.
The stop loss order is placed below the level, and the take-profit order should be placed at the distance of the height of the pattern from the breakpoint to the upside.
On the chart, both orders are indicated by red and green lines respectively.
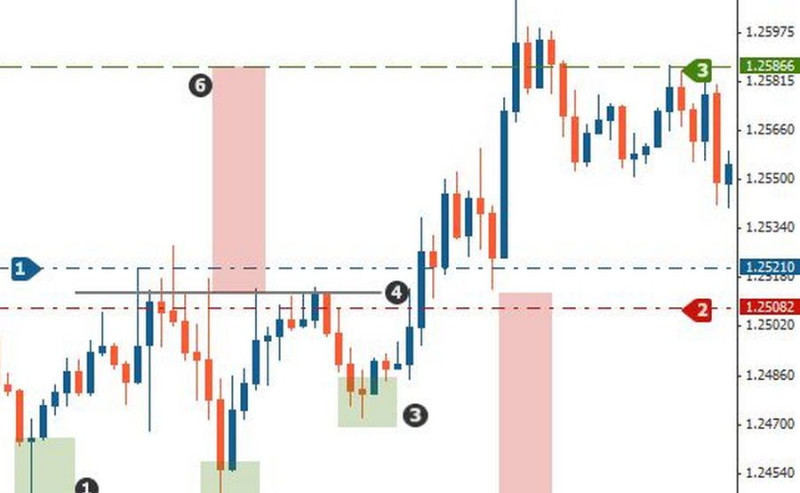
The second strategy has an optimal ratio of potential profits and risks.
Pros and cons
The standard and inverted head and shoulders patterns are used by many traders. They are popular due to the rather high accuracy of the signals.
The advantages of the pattern include:
- Possibility to use in different markets. The patterns can be used in securities, futures, foreign exchange, and cryptocurrency markets;
- Application to any time frame. However, do not forget that the higher they are, the more reliable the signals, so periods starting from a day are considered the most optimal;
- Usability, confirmed not only by traders but also by studies and research;
- It can be used both on line and candlestick charts. In this case, professionals note that the first option is more simple.
- The accuracy in determining the entry and exit points;
- The ability to use it with other technical analysis tools.
In addition, the practice of using the formation shows that it can be used effectively by different market participants:
- beginners can use it for building their own strategy;
- experienced traders use it to improve the accuracy of points to open positions;
- the effectiveness of using different time frames allows both intraday traders and long-term investors to use the pattern.
Along with the pros, the pattern also has its weaknesses. The disadvantages of the pattern include the following points:
- Formation of the pattern can take a long time, it is almost impossible to identify a pattern at the initial stage of formation;
- Many patterns are not perfect, which can make it difficult to identify them on a chart;
- The subjectivity lies in the fact that some patterns may not be noticed by traders. This is especially true for inexperienced traders;
- By the time the pattern is completed, the price has already gone a long way from the last peak or trough to the breakout point. This means that the opportunity to make the highest possible profit is missed.
Head and shoulders pattern: Different approaches
We have already talked about what the strategies can be when trading using the pattern. Their variability proves the fact that approaches to trading can be different.
Let's focus in more detail on the main points, which traders may apply in trading.
1. Moment of entry. This is based on the breakthrough point of the neckline.
The choice of the optimal moment to open a position is widely discussed in the trading community.
Thus, some players prefer to trade with the help of pending orders, placing them below the support level if we are talking about a standard formation. If the chart is inverted - above the resistance level.
That is, market players do not wait for the moment when the candlestick closes below the level. This means that there can be a false breakout, which will lead to financial losses.
Other traders are less risky because they open positions only after the price closes below or above the level, depending on the type of pattern.
However, even this less risky option has two scenarios for the entry point:
- opening a position immediately after the candlestick closes;
- opening a position after a retest, i.e. after the price bounces from the level after the breakout.
The second scenario is less risky, its implementation is shown in the screenshot. Opponents of this scenario pay attention to the reduced potential profit that it may bring.
2. Limited losses. This is a very important issue that prevents financial losses that may arise when there is a discrepancy between the forecast and the real situation on the chart.
For example, if contrary to our expectations, the quotes go up instead of down after a standard pattern is formed.
There are two points of view regarding stop-loss orders.
The first method assumes that an SL order should be located above or below the right shoulder. In the first case, we are talking about a standard pattern, in the second - we mean an inverted one. The main disadvantage of this method is the reduction of the potential profit, and the main advantage is lower risks.
The second method suggests placing the stop-loss order above the high or below the low of the last price fluctuation on the chart. Notably, the type of the pattern decides everything.
The screenshot shows an example of this method, using a standard pattern.
When determining the level for setting the stop loss order, professional traders recommend remembering that the smaller the distance from the entry point to the order, the greater the probability of early exit if the price starts even a slight correction;
2. Profit limit: a take-profit order allows you to automatically close a position when the price reaches a certain level. It ensures the deposit if quotes start to move in the opposite direction.
After all, the market is characterized by changes in the quotes.
At the same time, determining the point to place a TP order is important and complicated. Any market participant aims to get the maximum profit, and it is quite difficult to correlate the profit with the acceptable level of risk.
The first approach assumes that you place the order at the first key level.
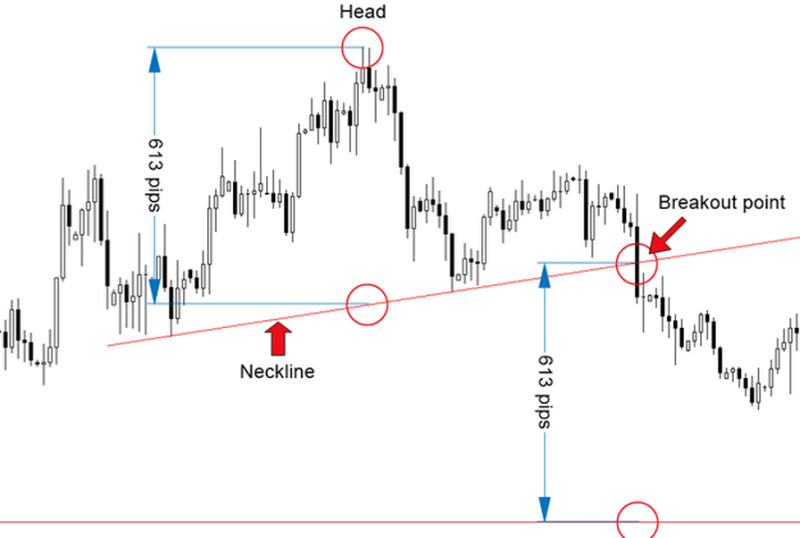
The second one involves using the target value of the asset. To do this, the distance from the top of the head to the neckline is measured, and then it is deferred from the breakpoint: down when a standard formation appears, up when an inverted one appears.
The example is shown in the picture below.
Importantly, the greater the distance from the entry point to the take profit order, the more aggressive trading is considered. This style is associated with high risks.
From all of the above, we can conclude that when trading according to the pattern, there is no single option involving the implementation of rigid rules. A big role in this process belongs to traders, who decide when to open a position and when to exit the market.
The main thing is not to deviate from your own trading strategy and observe the principles of risk management. After all, the pursuit of huge potential profits on the background of high risks can lead to losses.
Trading recommendations
The head and shoulders pattern, like its inverted version, can come in handy for any trader. Using this pattern in trading, it is important to follow certain rules.
They have been developed by experienced traders and allow them to solve the main task of trading: to get the highest possible profit at minimal risk.
- It is essential to analyze the trading volume. Especially, after the break of the neckline, the future trend should be supported by the growth of the activity of bulls or bears;
- Use other tools of technical analysis. For example, you can confirm a possible reversal with the help of Fibonacci levels;
- It is important to determine a trend before the pattern is formed. It should be bullish or bearish, depending on the pattern’s type;
- Analyze trades made on the basis of a formation's signals. Professionals recommend keeping a special notebook in which you can record the identified patterns and the results of trading using them.
Such analysis is especially important for beginners. You should pay attention not only to successful trades but also to unprofitable ones to analyze the reasons for failures;
- When trading, be sure to place stop-loss orders and calculate the potential profit. In this regard, you should not neglect the rules of risk management;
- Before you start real trading, you should practice trading on a demo account. Open a demo account with InstaForex and gain the experience you need.
Indicators
If you want to know how other patterns can be used in trading, you can read the article Full Guide to Reversal and Continuation Patterns.
In this article, we will tell you how you can simply find these patterns on the chart. There are specially created algorithms known as indicators.
They solve the following problems:
- exclude subjectivity in the identification of patterns as they identify them automatically;
- it saves time;
- simplify the process of using patterns by novice traders.
Let's dwell on some of the indicators, which can find the standard and inverted head and shoulders patterns.
1. PricePatterns, which alerts the user to the appearance of the head and shoulders pattern on the chart. Using the settings, you can activate or deactivate the search for certain patterns.
We should warn you right away that this indicator is not in the standard set of the MetaTrader platforms. It means that to apply it, you need to do the following steps:
- download the indicator and unzip the archive;
- transfer the file to the Indicators folder in the trading platform. To do this, you need to paste the unzipped document previously copied to the clipboard;
- restart the platform and open the chart you are going to use;
- drag and drop the indicator on the open chart. Besides, this can also be done through the Insert and Charts sections of the platform menu, as well as using the Navigator menu.
The indicator can inform about the head and shoulders pattern in the following ways:
- sound notification;
- push notification;
- email notification;
- pop-up window.
This can be adjusted in the indicator settings;
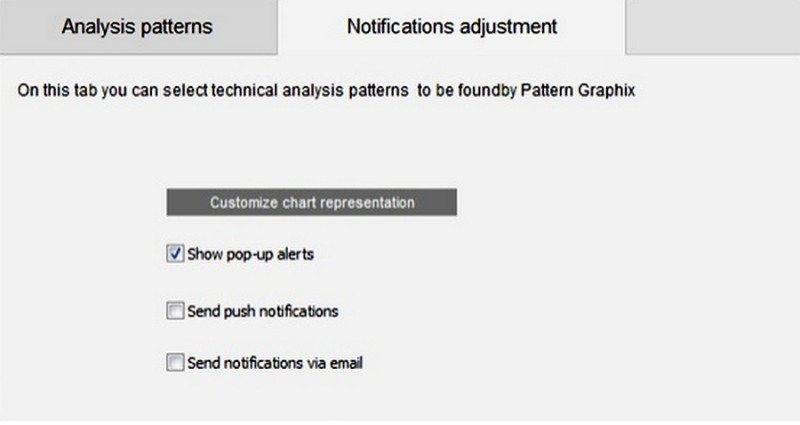
2. Pattern Graphix informs the user about graphical patterns with audio and visual alerts. This algorithm can be downloaded on the InstaForex website.
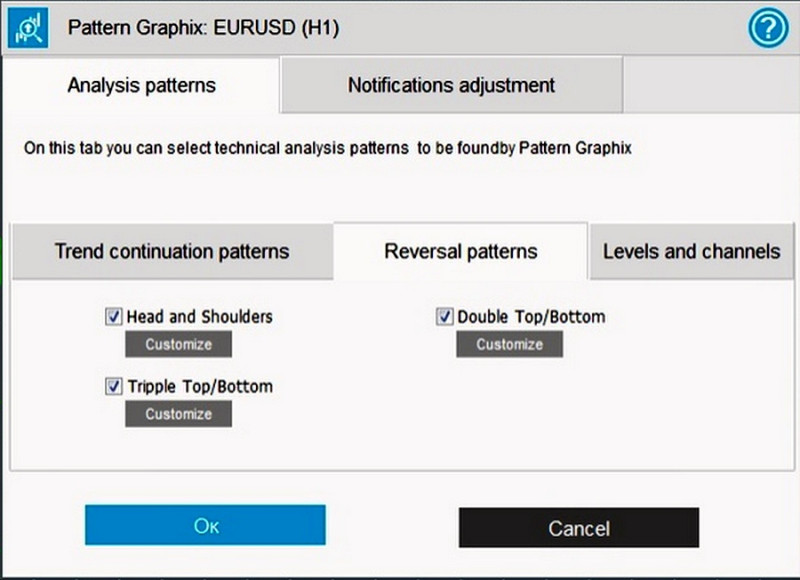
The Pattern Graphix settings involve:
- adjusting the list of recognized patterns;
- choosing the notification format: push, pop-up, email;
- specification of information about the found pattern: caption on the chart, description.
Usually, beginners do not find it difficult to use this indicator. In addition, the InstaForex website offers detailed instructions on how to use and install it.
3. ZigZag. This indicator, though not directly aimed at finding patterns, helps in their identification. Its main task is finding highs and lows on the chart.
Moreover, it makes it much easier to recognize graphical patterns by ignoring market noise.
When using indicators, it is important to understand that they are only helpers in trading. Each trader needs to create their own trading strategy, and then use the best tools to implement it.
What to pay attention to when trading
The head and shoulders pattern and its inverted version are considered one of the most reliable. Nevertheless, it is necessary to be guided by certain rules when using them in trading.
They allow traders to minimize risks and not miss important details in trading. This is especially important for beginners, who may make mistakes when identifying and working with the head and shoulders pattern.
Important tips:
1. A trend should be clearly seen before the pattern is formed. The standard pattern appears in uptrends, the inverted one appears when we have a downtrend.
To confirm a trend, you can draw a trend line, using the Moving Average or another indicator. The easiest way is to check that there were no highs or lows (in an inverted pattern) before the head and shoulders pattern is formed.
Simply put, much of the left side of the chart should look almost unmarked;
2. The head is the highest peak or lowest trough. The height of either shoulder should not exceed the height of the head.
The analogy can be drawn here with a living person. Nobody can raise their shoulders above the head.
Although there are no strict requirements for the proportions of the parts of the pattern, it should be identifiable even at a glance. If there are any doubts in this respect, it is possible to apply other tools of technical analysis or ignore the pattern;
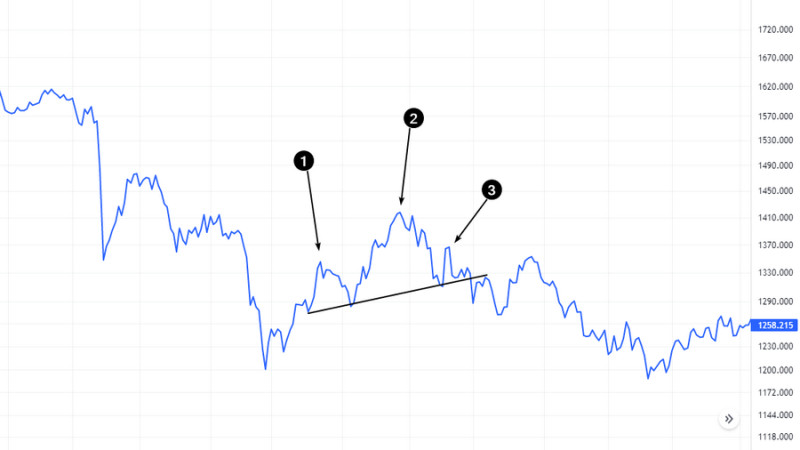
3. The neckline of the pattern has a certain direction. If we are talking about a standard one, the neckline is horizontal or ascending.
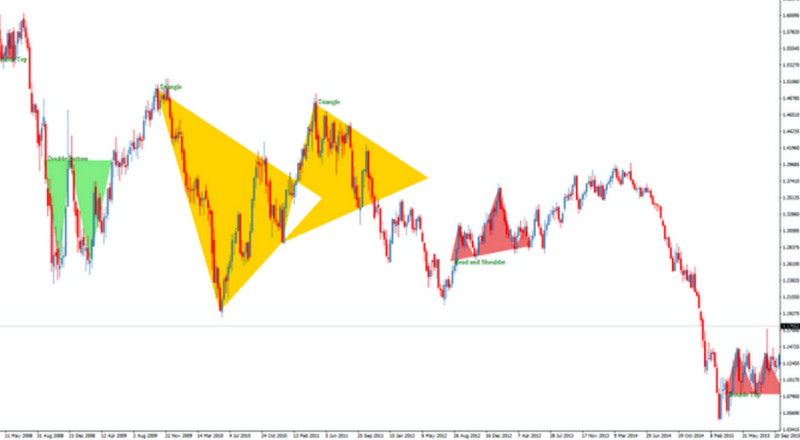
In the screenshot, you can see a similar to the head and shoulders pattern but is not one of them. The descending neckline proves this.
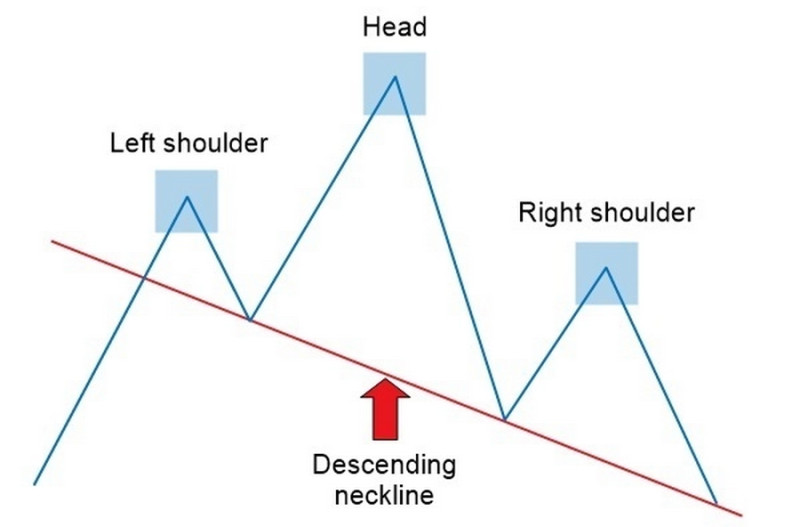
As for the inverted pattern, its neckline is horizontal or descending. At the same time, practice shows that the greater the slope, the stronger the reversal is;
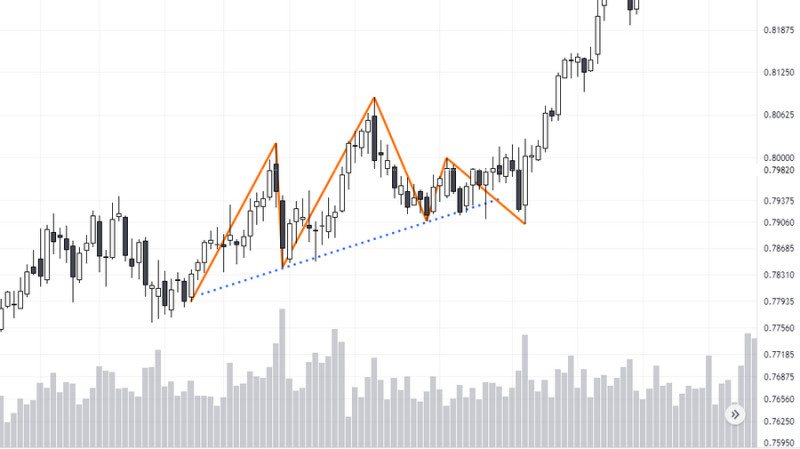
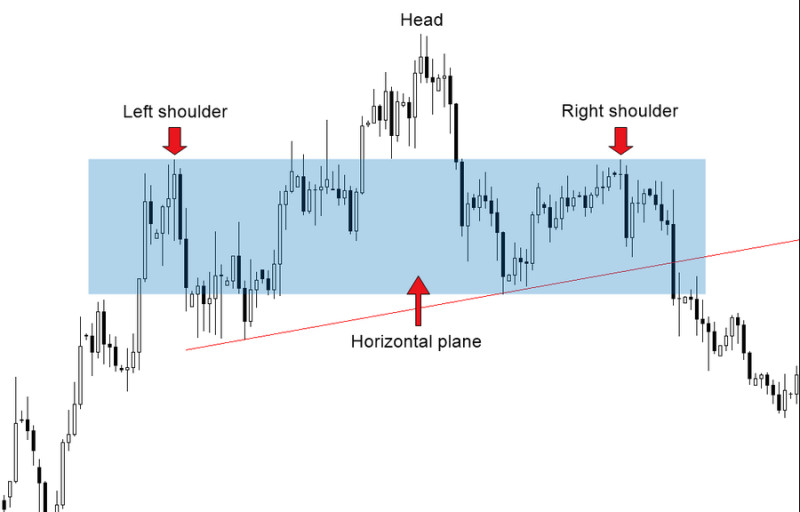
4. The shoulders are in the same plane. This does not mean that the right and left parts of the pattern must be symmetrical.
On the contrary, it rarely appears on the chart.
What is meant here is that a significant part of both shoulders must be located in the same plane, i.e. they should overlap each other. A pattern that meets this requirement is shown in the picture below.
5. The higher the time frame, the more reliable the pattern is. It is possible to use the head and shoulders pattern on H1 and H4 charts but experts pay attention to the fact that the risks of false signals may be higher.
That's why professionals use time frames starting from a day or higher.
The use of these tips in trading is not a guarantee that all trades will be profitable. However, it will help to reduce risks and minimize possible losses.
Conclusion
The head and shoulders pattern and the inverted version of it demonstrate highly reliable signals if used correctly. This means that trading using them has a good chance of meeting the traders' expectations for profit.
However, each trader should keep in mind that any pattern is just an auxiliary tool. It helps to put a trading strategy into practice but does not replace it.
In conclusion, to summarize the information of this article, we would like to highlight the main points about the pattern:
- A standard pattern is formed during a bullish trend, while an inverted pattern is formed during a bearish trend. In both cases, they signal that the current trend is fading, which means a looming reversal;
- The formation of the pattern ends with a break of the neckline. This is the optimal moment to enter the market;
- It is necessary to place SL and TP orders when trading;
- It is better to use the pattern with other technical analysis tools. These may be Fibonacci levels, moving averages, etc.
To start trading using the pattern, you need to open a live or demo account. You can do it with the InstaForex broker.
In the first case, trading will be carried out with real money, while the demo account provides you with a virtual deposit. The latter is recommended for beginners so they can hone their trading skills and gain essential trading experience.
You may also like:
Full Guide to Triple Top Pattern
Full Guide to Triple Bottom Pattern
Full Guide to Double Top Pattern
Full Guide to Diamond Reversal Pattern
Full Guide to Cup and Handle Pattern
Doji Candle: What is it and How to Use?
Full Guide to Pennant Chart Pattern
Gap Trading on Forex and Stock Exchange
Dividend Gap: Simple Explanation


