


A flag is a chart pattern that resembles a parallelogram. Learn how to spot it on the chart and use it efficiently when trading Forex.
The price of an asset is constantly fluctuating, thus forming various chart patterns along the way. In the article Full Guide to Main Technical Chart Patterns, you will learn how to identify different price formations and use them in trading.
This article will discuss what a flag chart pattern tells you and how to read and spot it correctly.
What is a flag?
Of all the varieties of chart patterns, a flag is the easiest one to recognize which makes it so popular among traders.
It is widely used by both professional traders and beginners.
A flag belongs to the continuation group of patterns and signals that the current market trend is set to continue.
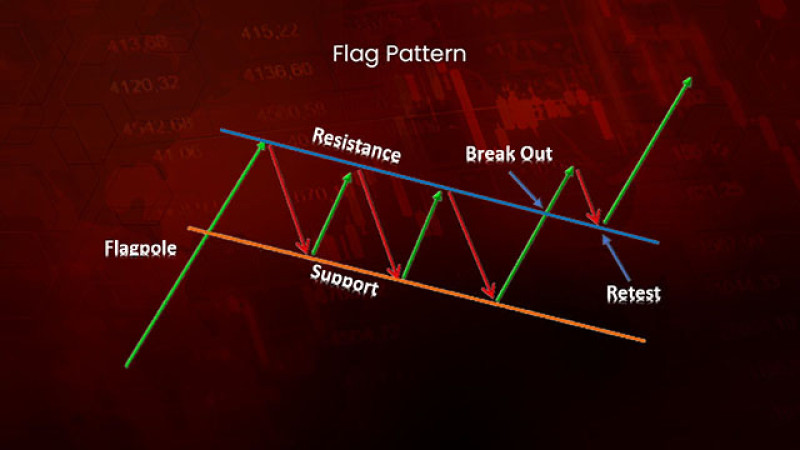
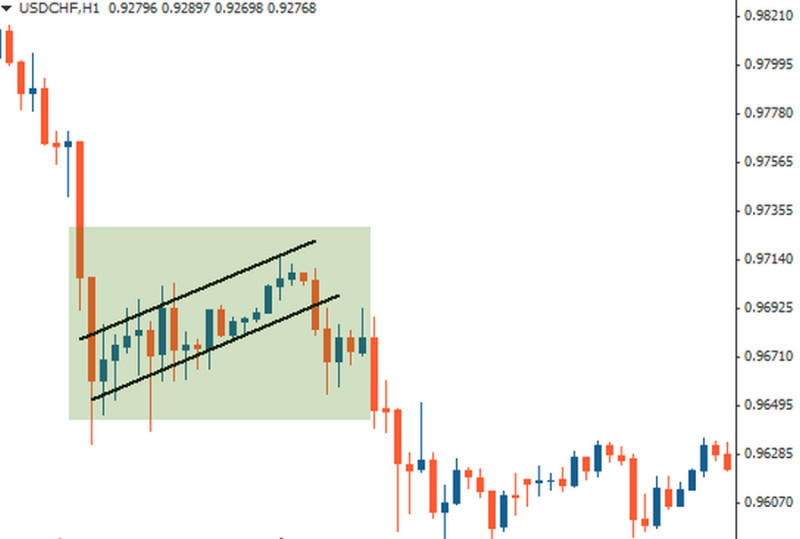
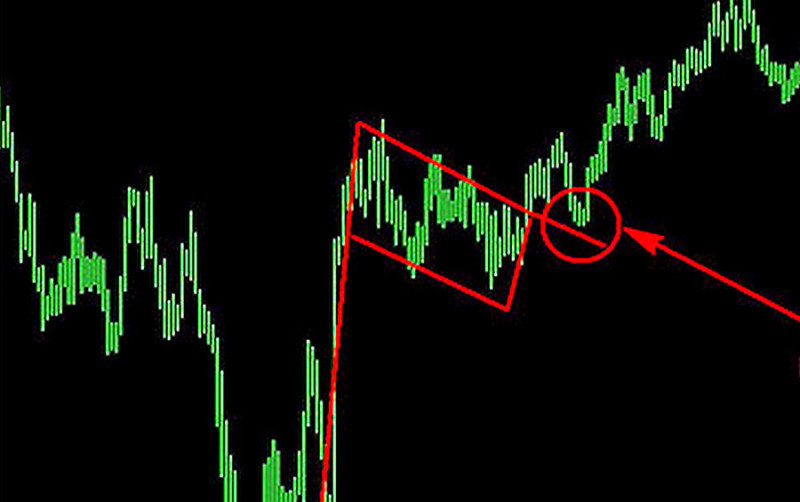
On the chart, the pattern looks like a parallelogram-shaped flag with a flagpole on either side. A flag reflects the following price action:
- The price is moving along with the trend but at some point, its movement is getting more rapid and strong. So, candlesticks reflecting the acceleration of the price movement make up a flagpole;
- Then the period of consolidation comes. The price is fluctuating within a narrow range resembling a rectangle or parallelogram, with its upper and lower lines forming resistance and support;
- After that, the price breaks through the pattern and keeps moving in the previous direction. In other words, the trend that was preceding the flag formation continues.
After the price has chosen a direction, it pauses for a while and then goes through a consolidation phase, meaning that either bears or bulls are building up new momentum.
The trend is considered confirmed when the price leaves the frame of the pattern.
Flag patterns have the following characteristics:
- A flag is formed in the middle of the trending market. The ongoing trend should be clear and strong, with no sideways movements.
- Consolidation takes place within a narrow channel between the two parallel lines.
- The consolidation channel is usually sloping.
- A flagpole reflects a sudden and considerable change in the price value and comes in the form of a vertical or slightly sloping line.
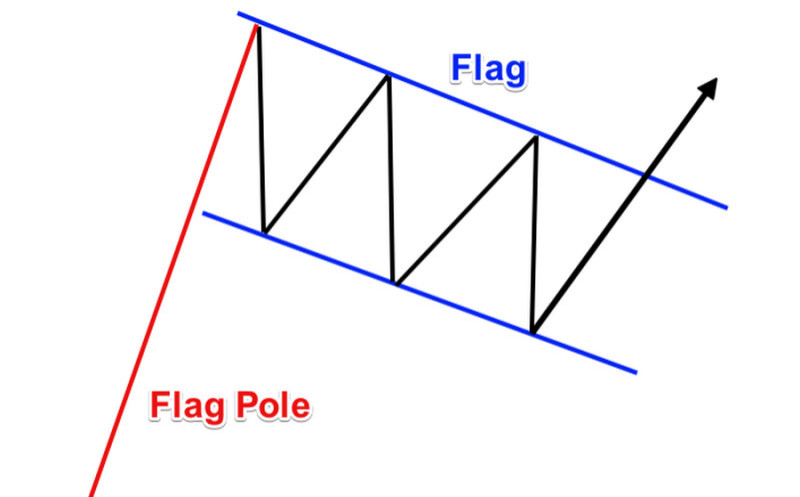
- Inside the body of the pattern, the price is moving counter to the prevailing trend. That is, the flag is sloping downwards if it was preceded by an uptrend and is pointing upwards if it was preceded by a downtrend.
- As a rule, the pole is longer than the flag itself which means that a rapid price move is longer than its correction;
- A pullback should be no longer than half the length of the preceding trend.
A flag is among the most reliable continuation patterns. It is very rarely followed by a trend reversal.
Types of flags
Depending on the initial trend, a flag pattern can be divided into two types. Once again, the prevailing trend usually continues after the formation is completed.
- A bullish flag appears amid an ongoing uptrend. After a period of consolidation, the price continues to rise. So, the bullish flag pattern signals the continuation of the bullish market.
- A bearish flag occurs amid a downtrend and indicates its continuation after the consolidation phase.
No matter which type of flag it is, the formation should meet the following criteria:
- It has to be preceded by a well-pronounced uptrend or downtrend. Do not look for this pattern when an asset is trading flat;
- The ongoing trend pauses for a while, and the price begins to fluctuate between the two parallel lines. During an uptrend, the body of the flag is usually sloped downwards while in a downtrend, it is angled upwards;
- The price continues to move in the previous direction after a breakout. The distance that the price covers after a breakout usually equals the one before the flag formation.
A flag is a short-term formation, and its bearish type forms faster than the bullish one.
Trading volumes
Despite its simplicity and reliability, the flag pattern should be confirmed with the help of other technical tools such as trading volume indicators.
When it comes to Forex, you should remember that we are talking about tick volumes that measure the number of price changes within a given time period.
In a bullish pattern, volume is characterized as follows:
- Trading volumes go up when a flagpole appears.
- In the consolidation phase, volumes tend to decrease and stay at around the same level.
- Trading volumes surge at the moment of a breakout as bulls step in to continue the trend.
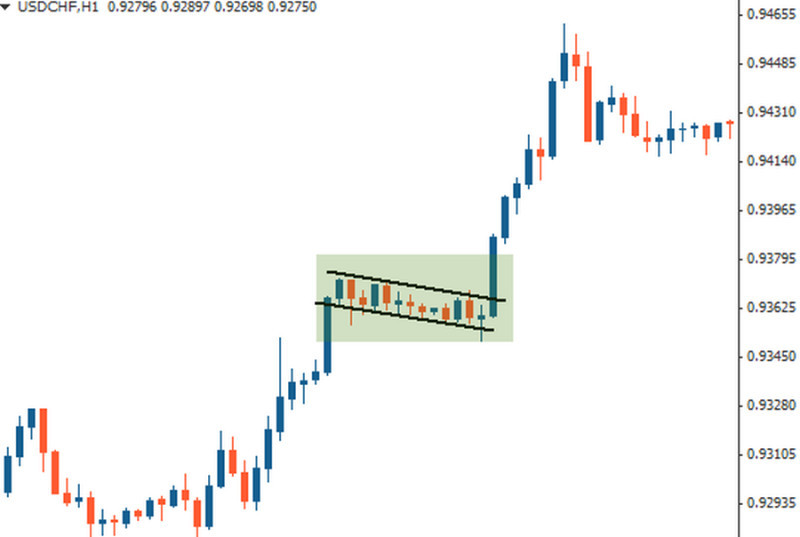
On the chart below, you can see how trading volumes are changing while the flag pattern is being formed. Market activity decreases in the body of the flag and then the price jumps rapidly to the upside following a breakout.
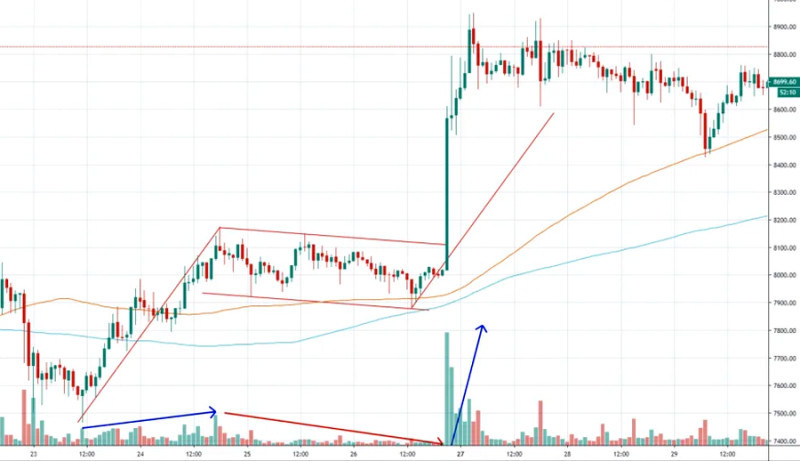
After a breakout, the pattern is considered complete, and the initial trend goes on.
As for the bearish flag pattern, trading volumes also increase at the moment of a rapid price change but then they stay almost the same during consolidation or a breakout.
In the picture above, you can see how trading volumes are changing in the bearish flag pattern.
Flags and other patterns
Experienced traders have definitely come across various reversal and continuation patterns.
Some of them are very similar to the flag pattern. We are talking about the following three formations:
- Triangle;
- Pennant;
- Rectangle.
Let’s look at the differences and similarities of these patterns.
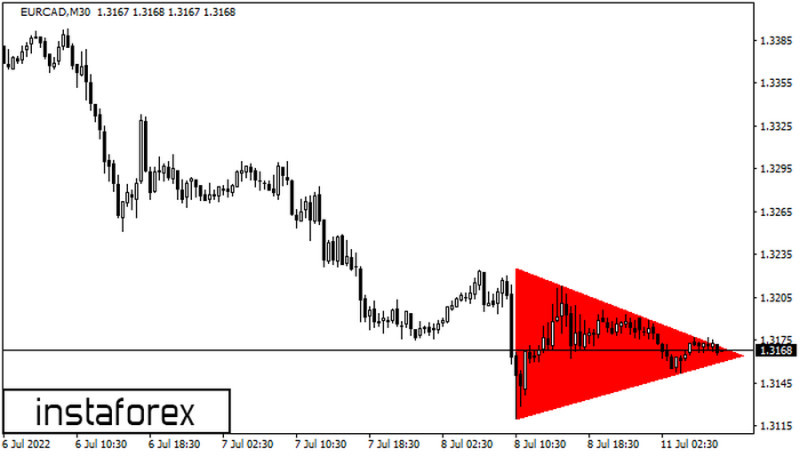
Both a triangle and a flag signal that the preceding trend will continue.
They appear amid an existing strong uptrend or a downtrend, so they can be either bullish or bearish. This is the main common feature shared by both triangles and flags.
Differences:
- a triangle has no flagpole;
- in a flag, consolidation comes in the shape of a rectangle or parallelogram, while in a triangle, the two lines are converging to reach an apex;
- a triangle is a long-term pattern and it usually forms over a longer period of time.
See the example of a triangle on the EUR/CAD chart below.
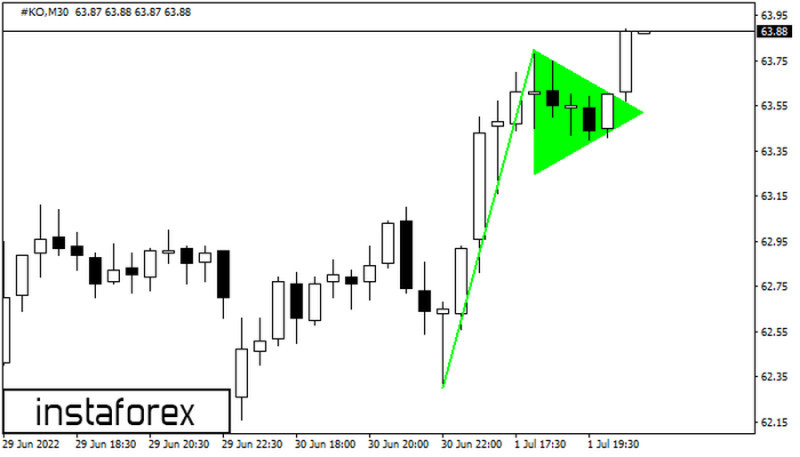
A pennant is another continuation pattern indicating the prevalence of an uptrend or a downtrend. Both a pennant and a flag have a mast, or a flagpole, which reflects rapid price jumps of falls. So, these chart formations consist of two parts.
In the case of a flag, the body comes in the shape of a rectangle and the price is fluctuating between its parallel lines. In a pennant, the lines are gradually converging.
In the picture below, have a look at the bullish pennant pattern.
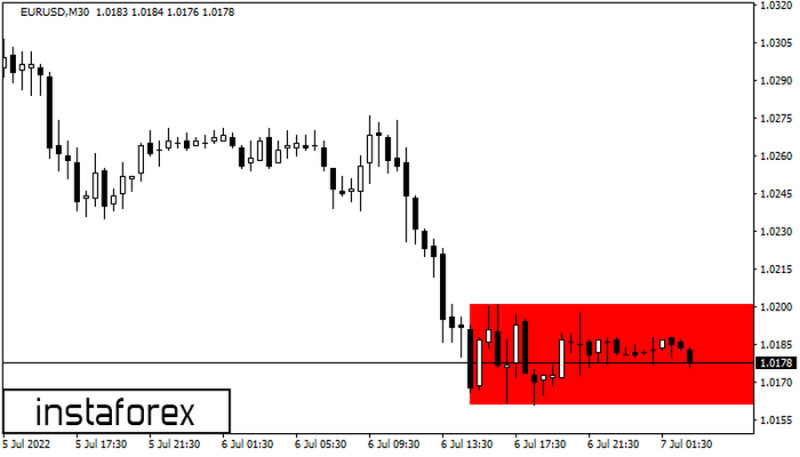
As for the rectangle, it also predicts the continuation of the trend but unlike the flag, it has no flagpole. Besides, its support and resistance lines are strictly horizontal.
In the screenshot below, the rectangle pattern predicts the continuation of the bearish trend.
Therefore, all the discussed patterns may look similar at first glance as they all predict that the price will keep moving in the previous direction. They also have a consolidation area which the price leaves to continue the trend.
However, these patterns have some significant differences that you need to consider to identify them correctly.
How to trade the flag pattern
When trading the flag pattern, you should focus on a breakout from the frames of the pattern.
If you are dealing with an upward movement, you should go long, and in the case of a downtrend, you should go short.
Let's discuss this strategy in more detail.
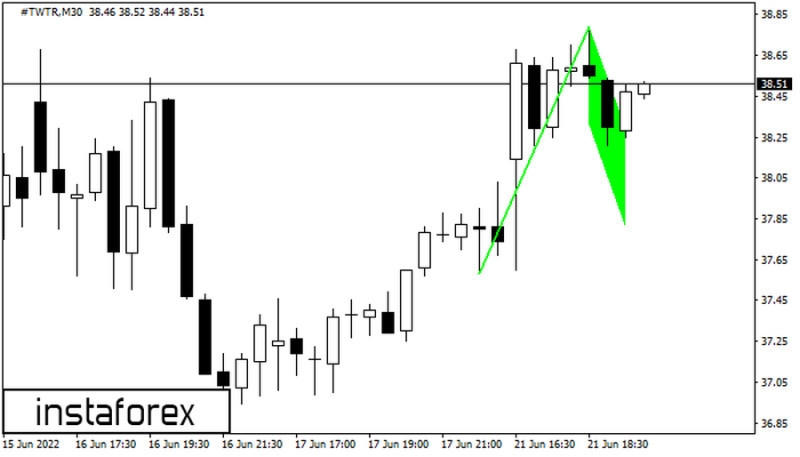
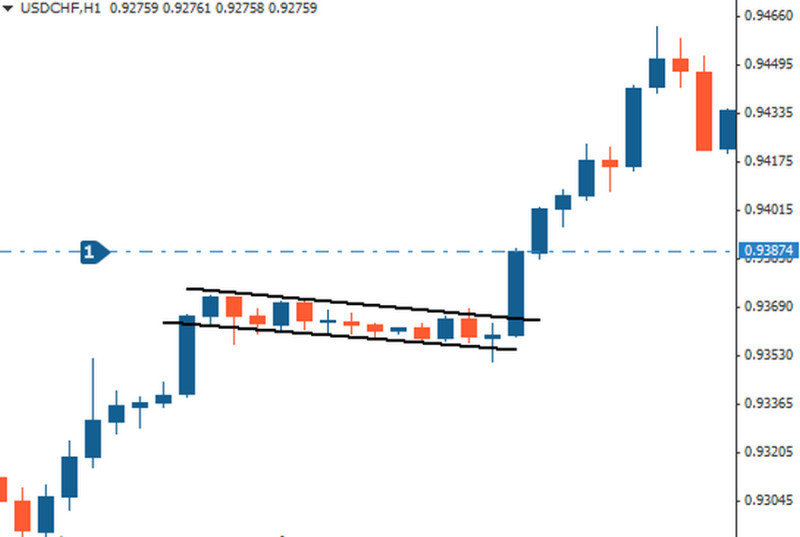
On the chart below, you can see that the price of the currency pair was rising in line with the bullish trend. Then, the pair formed a flagpole after a sudden surge in price.
After that, the quote was fluctuating between the parallel lines before crossing the upper line and moving further upwards.
A close of the candlestick after a breakout serves as an entry signal. This is the right moment to open a buy position.
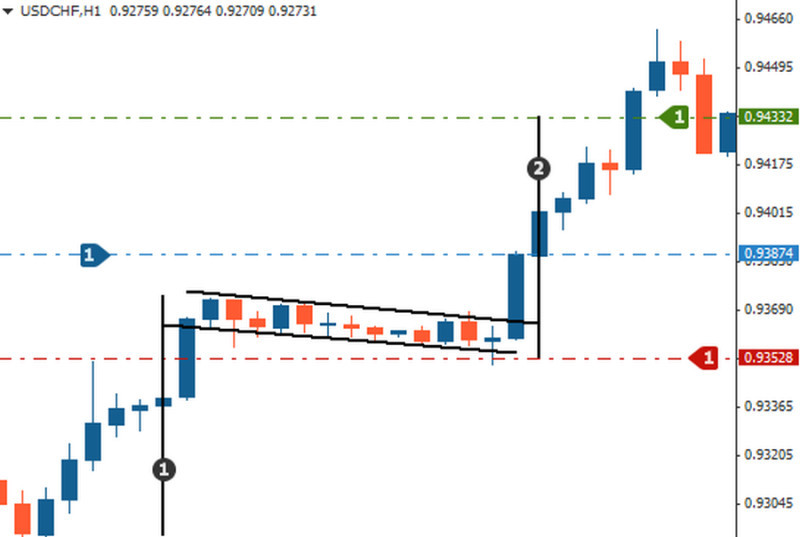
A Stop Loss is usually placed not far from the low of the pattern found inside the flag’s body.
To define the point to set a Take Profit, measure the distance between the pattern’s high and the base of the flagpole.
Then, apply this height to the low of the pattern to set a profit target.
As you can see on the chart, the buy entry point is marked with a blue line, the Stop Loss is represented by a red line, and the profit target is found at the green line.
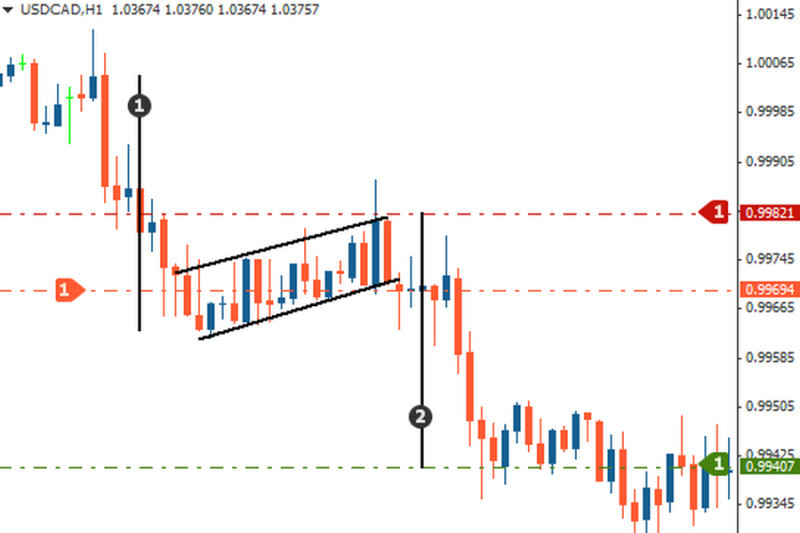
Follow the same strategy when trading a bearish flag pattern, with the only difference being that it should mirror the steps for the bullish pattern. On the chart below, the entry point is marked with an orange line, the Stop Loss is placed at a red line, and the Take Profit is located at a green line.
While most experts agree on an entry point, their opinions about a profit target differ. To set a take-profit order, some traders measure the height of the flagpole as was mentioned above.
Others prefer to use the height between the flag pattern’s trendlines. They measure this distance from the breakout point upwards or downwards to define the profit target.
You can open a position right after the price has crossed the trendline or you can wait until the quote returns to the breakout level and rebounds from it.
Check out the second scenario in the screenshot below.
While trading the flag pattern, keep in mind trading volumes. Their increase at the moment of a breakout indicates that the price gained even stronger momentum to continue the preceding trend.
A trading volume may change in the course of consolidation which serves as another confirmation of the pattern signal. It declines during a countertrend and rises when the quote reverses toward its previous direction.
Before opening a trade, make sure that you are dealing with the flag pattern:
- A flagpole should be located vertically or near so and should be represented by fully formed candlesticks.
- Pay attention to the body of the pattern: it should be sloping down during a bullish trend and up when there is a bearish trend.
- The upper and lower boundaries of the pattern should be two parallel lines.
A flag can be used on any time frame which makes it suitable for short-term and swing trading.
So, a flag has the following advantages:
- suitable for trading any assets and markets;
- helps to easily identify entry and exit points;
- follows the main principles of risk management;
- can be used on different time frames, most often starting from M15.
As for disadvantages, newcomers may find it difficult to spot this pattern on the chart. In this case, various technical indicators come to the rescue.
Indicators
To find out more about various technical chart patterns, read the article Full Guide to Reversal and Continuation Patterns.
And now we will discuss indicators that help traders recognize these patterns on the chart. These technical tools will save you time and effort as the algorithm accurately identifies the patterns you need and notifies you about it.
All you need to do is open a trade at the right time and then lock in profit.
Let’s see how this works with the Pattern Graphix indicator. This is a very popular and easy-to-use indicator that you can download from the InstaForex website.
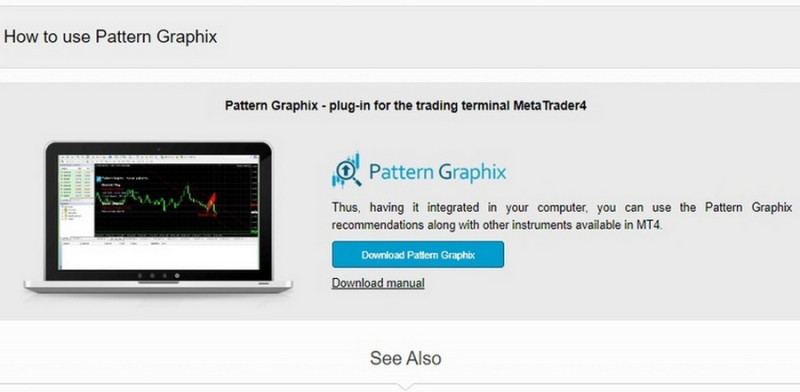
After downloading and adding the indicator to your trading platform, you will get visual and sound notifications when the program spots a pattern on the chart. You can adjust the list of patterns that the indicator will be looking for through Settings.
All tools are divided into three groups:
- Continuation patterns, including the Flag;
- Reversal patterns (Head and Shoulders, Triple Top/Bottom, etc.);
- Lines and levels (Support and Resistance, Fibonacci levels, etc.).
In Settings, you can also customize the color of the chart and add or deactivate push notifications and messages to your email.
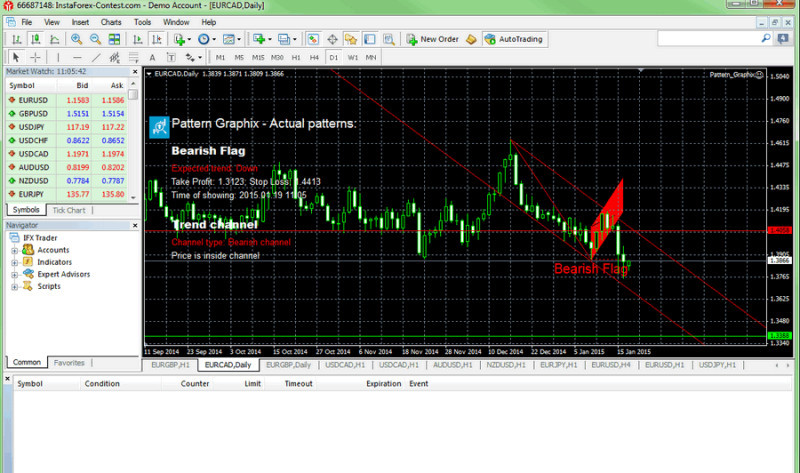
Pattern Graphix is a free indicator. In the screenshot below, you will find the use of the indicator on the EUR/CAD chart.
Apart from labeling the found patterns, Pattern Graphix also
- indicates the time of their emergence;
- suggests Stop Loss and Take Profit points;
- forecasts the further direction of the trend.
To add the downloaded indicator to the chart, just drag it there from the Navigator section. You can find detailed installation guidelines on the InstaForex website.
Conclusion
A flag is a very common technical pattern that allows traders to get profit with minimal risk. However, this formation cannot guarantee that the price will reach this particular level within a certain time period.
In other words, this pattern helps you define the direction of the trend when consolidation is over but does not give you any certain targets. You can predict the outcome by measuring the height of the momentum movement.
Keep the following in mind to make the right trading decisions:
- The pattern appears in the middle of the existing trend;
- It helps you buy or sell an asset at a better price;
- A flag can be either upward trending or downward trending;
- Enter the market when the price breaks out of the pattern;
- Set stop-loss and take-profit orders;
- Trading volumes are important. They tend to increase in the bullish flag pattern during a price surge and a breakout;
- Signals are more reliable on longer time frames.
To trade the flag pattern, you need to open a trading account. Go live or trade on a demo account with InstaForex.
Read more:
Full Guide to Triple Top Pattern
Full Guide to Triple Bottom Pattern
Full Guide to Double Top Pattern
Full Guide to Diamond Reversal Pattern
Full Guide to Head and Shoulders Pattern
Full Guide to Wedge Chart Pattern
How to Use Cup and Handle Chart Pattern
What is Doji candlestick and how to use it
Full Guide to Pennant Chart Pattern
What is Gap in FX and Stock Trading
Japanese Candlestick Patterns in Technical Analysis
Full Guide to Double Bottom Pattern


