


Quite often, traders can find patterns on a chart that help them to predict the further dynamics of the price. Detailed information about pattern is presented in the article Technical Analysis Patterns.
This review is devoted to the Cup and Handle pattern. Read on to learn how to identify this pattern, how it helps traders, and how it differs from a reversed version.
Pattern on a chart
Currently, the list of pattern that traders have at their disposal is huge. Some of them indicate the continuation of the trend, others indicate its termination and reversal.
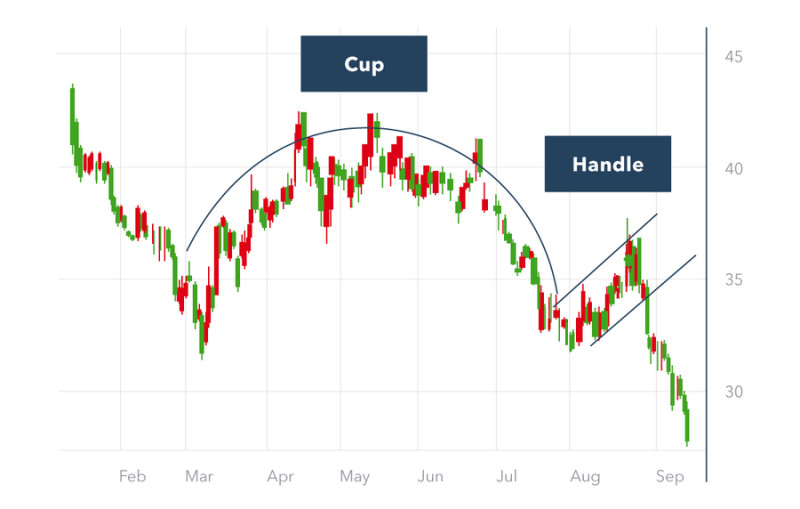
The Cup and Handle pattern is of a continuation type. It is a complex pattern that is also sometimes called simply a Cup or a Mug.
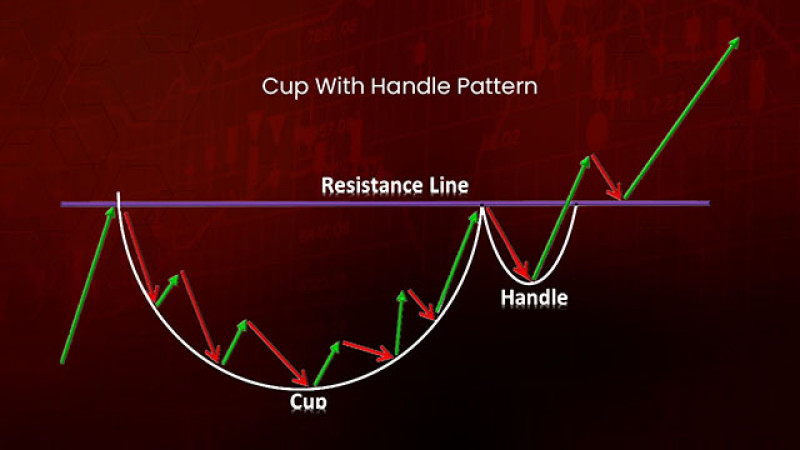
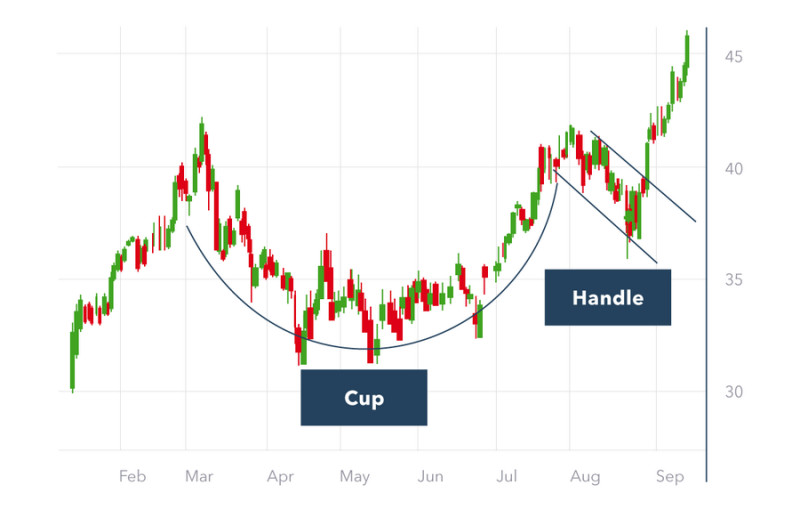
The pattern has this name for a good reason, because it actually looks like a cup with handle on a chart.
The pattern was developed by stock trader William O'Neil, who presented it in the second half of the 20th century. According to him, the formation of this pattern can take about two months to form.
In practice, the formation of the Cup and Handle can take longer.
The Cup and Handle pattern appears on any timeframes, but the most reliable are H1 and older. At the same time, experienced market participants agree that it appears on charts quite rarely.
A specific feature of the pattern is not only its appearance. Another distinguishing feature is that it is formed only in a bullish market.
Its appearance signals that the upward movement is likely to continue after the period of consolidation.
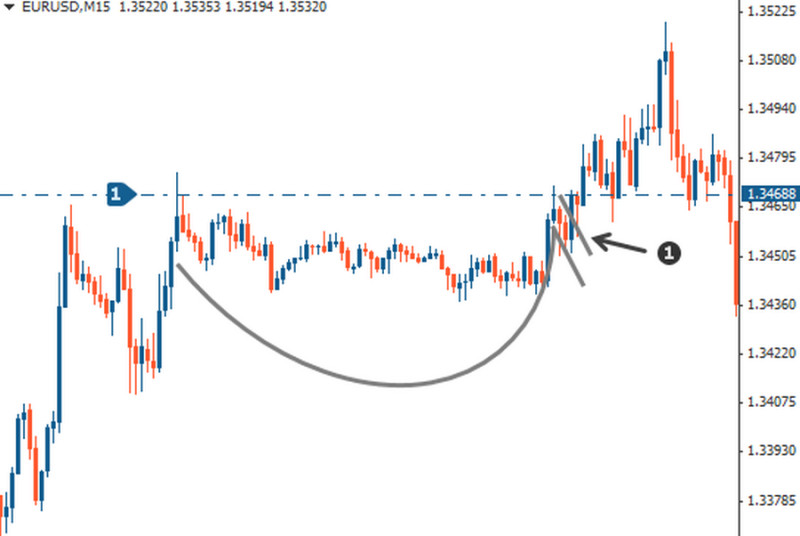
In real trading, it looks as follows:
- An asset price is growing, demonstrating an uptrend. During this period, prices rise as bulls are active.
- After a price reaches the peak, a correction period begins, during which the bottom of the pattern is formed. Most often, this indicates that bulls have fixed their profit.
Then the price smoothly resumes growth, and the cup completes. That is, the activity of buyers increases again. - The second part of the pattern is formed following another correction. The bulls become relatively passive, while the bears lack the potential to push the price lower.
- Bulls' efforts bring results, and the price continues moving upward upon breaking the high. That is, at this moment, you can observe a breakdown and consequent rebound from the resistance line, just where the formation of the pattern started.
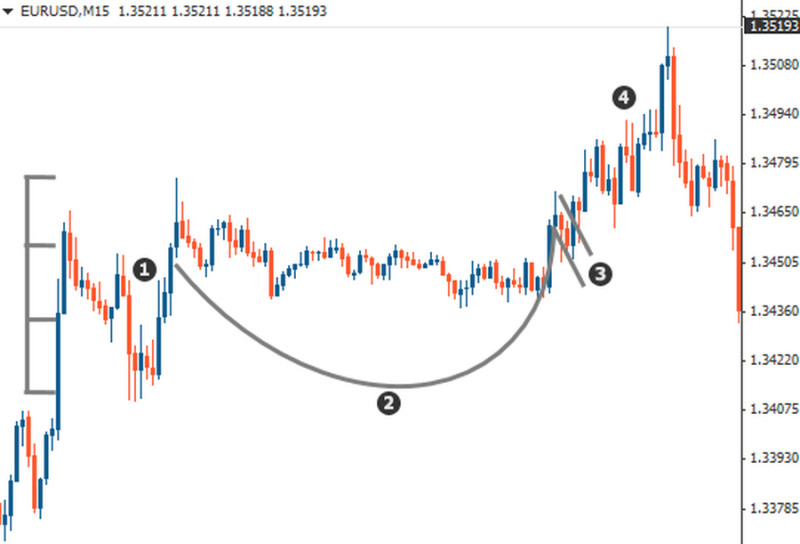
All these stages are shown on the EUR/USD chart below.
At the same, an ideal pattern should meet the following requirements:
- the depth of the arc does not exceed 70-75% of the height of the initial bullish trend;
- the arc dip should be smooth, that is, the correction is characterized by a gradual price change;
- the length of the second part, the handle, should be at the most twice shorter than the first element;
- the handle should stay above the middle of the pattern;
- the correction within the handle is within the growing part of the arc. As a rule, this ratio does not exceed 1/3-1/2;
- the formation of the second element is considered complete when the price breaks through the level and moves up.
Most often, the Cup and Handle pattern is characterized by the following indicators:
- The depth of the cup is three times the height of the handle;
- The length of the cup is five to six times longer than the handle;
- The edges of the pattern are approximately on the same line, which is the resistance level. After the formation of the Cup is completed, the price breaks through it.
At the same time, when analyzing the model, it is important to pay attention to the trading volume during its formation. At the moment of a breakout, the volume increases, which indicates the reinforced strength that the main trend is gaining.
The pattern formation
We have already described the conditions that an ideal pattern should meet. However, such pattern appear quite rarely, so here we provide the must-be conditions and discrepancies that are allowed when this pattern is formed.
- It appears in the middle of a bullish trend. If it happens this way, then this is ideal.
Formation at the final stage is also possible, but in this case the reliability of the patten is low. - The underlying trend is clear and pronounced. If things are not so clear in this regard, the likelihood of a bullish trend continuation is reduced.
- The smoothness of the cup element. Ideally, it should resemble an arc. V-shaped patterns with a sharp bottom are also acceptable, but their signals need additional confirmation.
- The depth of the first element should be up to 75% of the height of the main trend. In practice, quite often this figure is 50-60%.
- The handle can have a different shape and direction. For example, it may resemble a triangle, a flag, and other patterns.
That is, a correction can occur both in a sideways trend and in a downward one. - Ideally, a breakout occurs at the level of the upper boundaries of the pattern. But it can also be fixed below this level, when the handle has a clear downward direction.
- The most reliable timeframes are H1 and older. The minimum is the hourly timeframe. The older they are, the higher the accuracy and the more efficient the received signal.
- A breakout can be confirmed either by crossing the resistance level or the upper border of the handle. It all depends on the style of trading that a trader practices.
If this is aggressive trading, the entry signal is a breakdown of the boundaries of the pattern. Convervative traders can use a break of the resistance line as a signal. - An increase in trading volumes at the time of a breakout is a necessary condition. Otherwise, the potential for further continuation of the trend is doubtful.
How to trade the Cup and Handle
As we are describing a pattern that indicates a continuation of the bullish dynamics, it means that buying positions will be appropriate when using it. After all, the bulls are interested in the fact that the asset they buy rises in price.
Particularly, the price most often rises after the completion of the pattern formation.
The simplest and most common trading method is to open long positions after a breakout. That is, when the price crosses the trend line of the handle, located above, and the candle closes above it. It serves as a signal to buy an asset.
In this case, a trader needs to set a stop loss below the price low, which was fixed during the consolidation in the second part of the pattern, that is, the handle. After all, if quotes fall lower, only a stop loss will save you from financial losses.
A take profit should be set above the point where a breakout occured. The distance should be determined by the depth of the first element of the pattern, that is, the cup.
In other words, the depth of the arc should simply be added to the intersection point.
How to measure the depth correctly? To solve this task, there are several options.
So, if the right edge of the arc is located below the level of the left one, it is necessary to take the distance from the first to the lowest point of the bottom as a basis. If the edges touch the same level, the reading should start from the resistance level.
On the chart below, the recommended stop loss is under number 2, while a take profit is number 3.
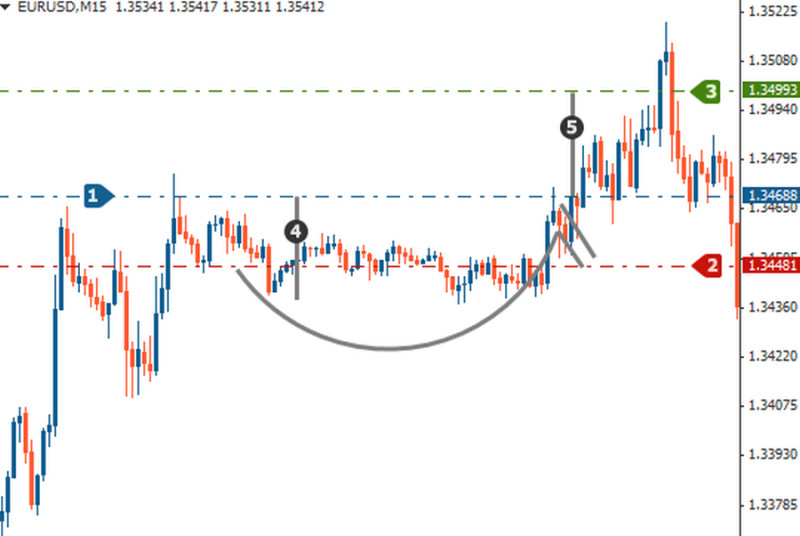
At the same time, there are some other options besides the one that we described. Any trader is free to adjust the levels of stop loss and take profit and determine the entry point on their own, taking into account their experience and skill.
In general, the Cup and Handle trading style can be conservative and aggressive. Both these styles have their pros and cons.
In the first case, trades are opened after a breakout of the resistance level, and a stop loss is fixed below the handle. That is, this trading method involves lower risks.
The second option involves opening deals after the breakout of the pattern, and a stop loss in this situation is set directly below it. Trading with the use of this method is considered more risky.
Trading rules using the Cup and Handle pattern:
- If possible, longer timeframes should be used. The periods shorter than H1 do not provide reliable signals, so this pattern is not suitable for short-term traders.
- One should not expect a quick profit, because the formation of the pattern can take not only weeks, but also months. In addition, it is almost impossible to recognize this model at the very beginning of its formation.
- The resistance line that connects the price highs within the pattern is often crossed during releases of important news and economic events. That is why it is important to keep track of them in the Economic Calendar by InstaForex.
At the same time, it is important to understand that trading can be carried out using both market and pending orders. If you stick to the classical style, then in the second case, the order to buy should be placed above the resistance level.
The target level should be set equal to the height of the cup measured from the resistance line, so a take profit should be fixed either at this level or a little lower.
The best place for a stop loss is below the minimum price formed inside the handle.
How to confirm signals
A break of the Cup and Handle pattern warns traders that it is the right time to enter the market. However, some experts think that additional tools should be used to confirm such a signal.
We have already mentioned that trading volumes can serve as confirmation. So, when the pattern is just beginning to form, this indicator usually decreases.
Then, when the arc touches the bottom and rebounds, the volumes gradually increase. Their next decline begins at the beginning of the handle formation.
A breakout is a sign of the pattern completion. Upon this, the volumes grow again, and sometimes quite sharply.
In addition to using volume indicators, you can confirm signals in the following ways:
- Switch to a longer timeframe to make sure that the pattern is valid. For that purpose, you can use weekly or a monthly timeframe.
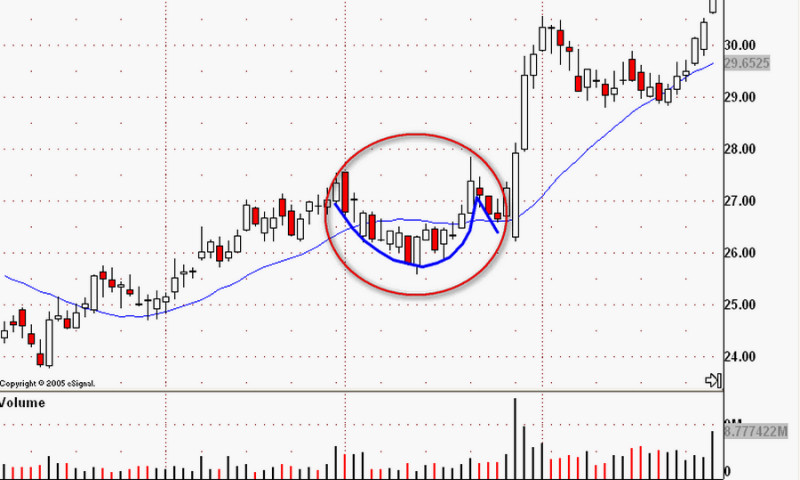
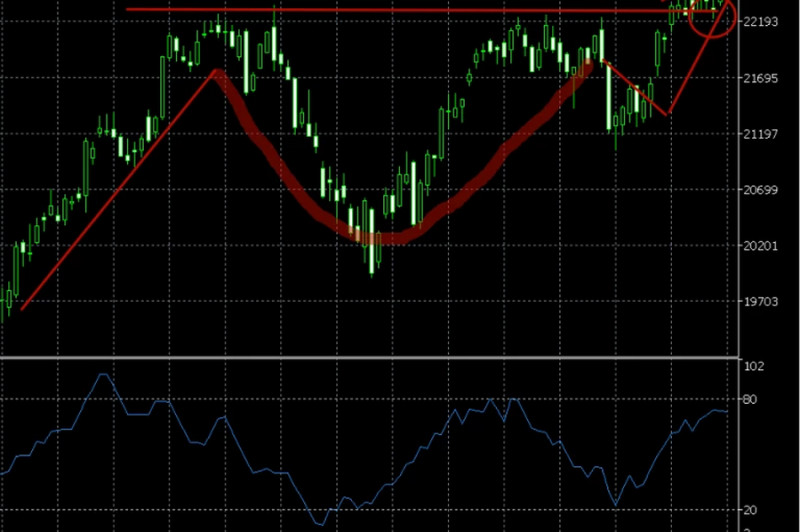
- Add a Moving Average 200 to a chart. If the cup is true, the line will be placed under the handle.
- Make sure there was a bullish trend before the pattern formation started. Otherwise, you'd better wait for more suitable trading opportunities.
- Check how the formation looks like and make sure it satisfied the criteria described above.
So, before you starting trading using this pattern, it is important to make sure that you have actually found the Cup and Handle. After that, check its validity.
You'd better ignore the patterns that have been formed on short timeframes and don't hurry to open positions. In trading, sometimes it is better to take a break than to take an unreasonable risk.
Pros and Cons
Before we start describing the advantages and disadvantages of the Cup and Handle, let's draw your attention to the fact that it is only one pattern in a great variety of all existing ones. Other patterns that can also be of help in trading are described in the article Trend Reversal and Continuation Patterns: A Detailed Guide.
The advantages of the pattern are:
- High accuracy of signals, 80% on average. However, this is provided that the Cup is identified correctly and all the conditions for its formation are met.
- Great profit potential for medium and long-term traders.
- Recognized for its performance in the stock and other markets. This pattern is often used in CFD trading.
- Easy to identify on a chart. When the pattern formation is completing, even beginning traders can find it on a chart.
At the same time, the pattern described in this article also has its drawbacks. Here are the main ones:
- It can be found on price charts quite rarely. Statistically, only about 2% of market participants use it.
- It is a long-term pattern, that is, its formation takes a long time.
- It does not suit traders who trade short-term.
- The pattern cannot be identified at the beginning of its formation. As a rule, it is possible to recognise it on a chart only at the final stage of its formation.
Based on the above, we can conclude that building a trading strategy solely on this pattern is useless. In this case, you will have to wait for some profit for a long time.
But using it together with other technical analysis tools is a good idea for both experienced traders and beginners.
The Reversed Cup and Handle Pattern
As the name suggests, the reversed pattern is a mirror image of the standard one. At the same time, it is worth noting that the author of the original Cup and Handle did not mention anything about the reversed version. That is, this figure was identified by traders in the course of their activities.
However, the relevance of the reversed Cup and Handle is still questionable.
This pattern is formed on a bearish trend and signals that the main trend will continue after a slight price consolidation. Its depth should be at least 32% less than the height of the previous trend.
How the reversed cup differs from a standard one:
- Appearance: on a chart, the patterns are mirror images of each other.
- The signals interpretation: the first one signals a short opportunity while the second one prompts traders to go long.
- The vector of price movement: in the first case, the pattern appears during a downtrend, in the second case, during an uptrend. Accordingly, these trends continue after the breakout as bears and bulls become more active.
In other aspects, the rules for trading using these two formations are identical, but in a mirror image. The reversed Cup and Handle is confirmed if the price breaks the pattern or level from top to bottom.
At the same time, the trading volumes should increase.
Sometimes, the pattern appears during a bearish trend, not a bullish one. In this case, it can signal not a continuation but a reversal of a trend.
The same refers to the standard Cup: if it is being formed during a bearish trend, then it can be considered a signal of an upcoming trend reversal.
However, these patterns signal reversal quite rarely. This is an exception rather then a tendency.
Conclusion
Summing up, we can conclude that both the Cup and Handle pattern and its reversed variant indicate the period of correction of a current trend. In the first case, we are speaking about an uptrend, while in the second case, it is a downward trend. In most cases, the current trend continues after the pattern formation completes.
Important features of the above patterns are:
- Long period of formation, i.e. the formation of this patterns takes a long time.
- Two elements: each formation consists of two parts.
- Roundness of the first element.
- The pattern is confirmed through a breakout.
- Universality: despite the fact that patterns are most often used in stock trading, they are also can be applied in forex trading.
To try out the pattern in practice, you need to open a real or demo trading account. You can do it with InstaForex.
You may like:
Full Guide to Triple Top Pattern
Full Guide to Triple Bottom Pattern
Full Guide to Double Top Pattern
Full Guide to Diamond Reversal Pattern
Full Guide to Head and Shoulders Pattern
Full Guide to Flag Chart Pattern
Doji Candle: What is it and How to Use?
Full Guide to Pennant Chart Pattern
Gap trading on Forex and Stock Exchange
Dividend Gap: Simple Explanation


