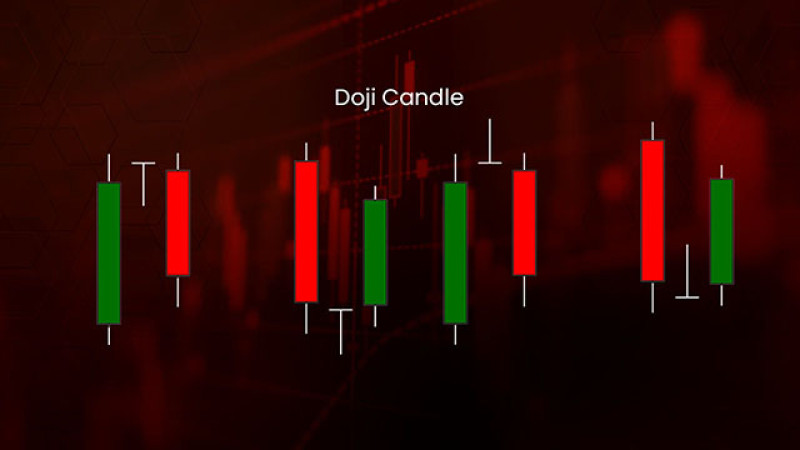
For effective trading, it is essential to predict correctly whether the quotes will move up or down. Find more information about this in our article Full guide to reversal and continuation trend patterns.
Meanwhile, in the article below, we will discuss the Doji candlestick pattern. Read more about what this exotic name actually means and how this pattern is classified and used in trading.
Spotting Doji on the chart
Of all the varieties of Japanese candlesticks, a Doji is considered to be the most important one. It can be used both as a separate tool of technical analysis and as a component of more complex patterns.
In Japanese, “doji” means mistake or inaccuracy. The appearance of a Doji on the chart means that the market’s opening and closing price is almost the same despite sharp fluctuations within the session.
This term is used to refer to Japanese candlesticks with a very short body but long shadows. Yet, the size of the body should be used as the main criterion when determining this pattern.
If the body is relatively small, this means that the opening and closing price on a certain time frame was almost the same or even equal.
Another type of pattern is a symmetrical candlestick that has a very small body that appears as a thin line on the chart.
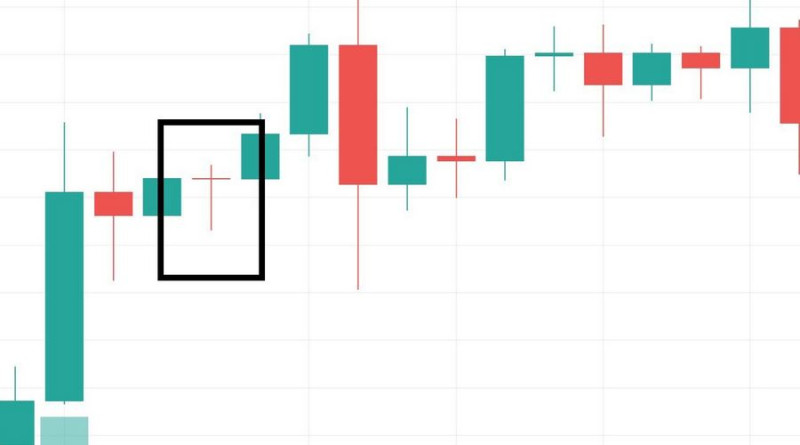
If there is a slight difference in the opening and closing prices, we are dealing with an asymmetrical pattern. Yet, there is no clear definition of the acceptable deviation range.
Some experts think that in the Doji pattern, the body should take no more than 5% of the whole candlestick length, including the shadows. If this proportion is violated, then we are talking about the Spinning Top pattern.
In this regard, the price of the asset is also an important criterion to watch.
Let’s say, the shares of a particular company are trading at an average of 500 standard units per share. If the difference between an open and close is 0.5 units, we are dealing with a Doji.
If a security is valued at 10 standard units, then a discrepancy of 0.5 standard units will be displayed on the chart as a pattern with a long body.
Apart from this, it is important to take into account previous volatility of the instrument and to analyze other candlestick patterns that appeared before the Doji candle.
In fact, this pattern represents the struggle between buyers and sellers in a given period of time. If a candlestick is perfectly symmetrical, then neither bulls nor bears have won, which means none of the sides managed to gain control.
Doji can also mean that:
- buyers and sellers have equal power;
- there are no market participants in play who can potentially influence the quotes;
- a level is being tested.
Yet, the first variant is the most common one. It is believed that a Doji signals uncertainty and indecision in the market.
At one point, the efforts of both buyers and sellers become equal until one of the sides gains advantage over the other.
And the winning side will define the future direction of the price.
When trading the Doji candlestick pattern, you should consider the following aspects:
- If a Doji appears among other candlesticks with long bodies, it is deemed more significant. However, a Doji that forms among candlesticks with small bodies is considered less important;
- Symmetrical Doji candlesticks are more relevant than those that merely demonstrate the difference in the opening and closing price;
- The ascending or descending nature of the pattern depends on the preceding trend and the future confirmation. Alone, Doji are considered neutral patterns.
What does Doji consist of?
As we have already mentioned, the body is the most important part of a Doji. This is the element traders should focus on when identifying the pattern.
But since most Doji have shadows, let’s discuss what they mean in different situations.
- If upper and lower shadows are of the same length, this means that bulls and bears made equal efforts to gain control over the market. If a Doji is not symmetrical, the body shows who has more advantage in this struggle.
If the pattern is fully symmetrical, then none of the sides has won; - Short shadows indicate that the price range on the given time frame was relatively narrow. In other words, buyers and sellers have almost reached a balance and their efforts were equal over a certain time period;
- If one shadow is longer than the other, then one of the sides was dominating the market at some point. When bulls are prevailing, this is shown by a long upper shadow. Strong bears are represented by a long lower shadow.
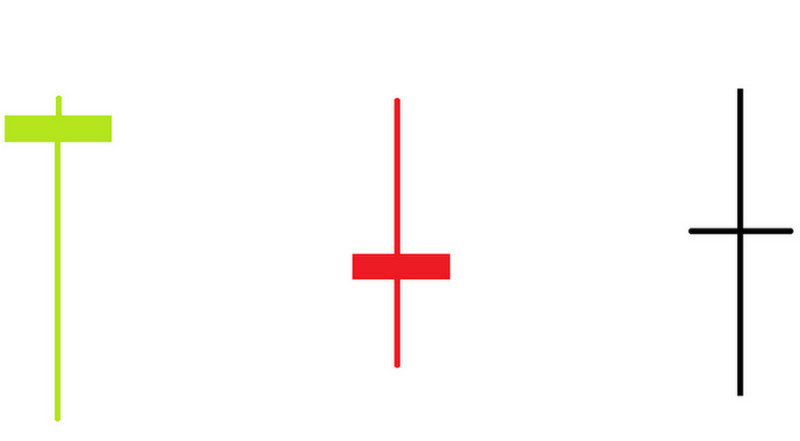
Therefore, to spot a Doji on the chart, you should first of all look for the candlestick body. But bear in mind that if the pattern is accurate, it will appear as a line on the chart.
For a better understanding of the Doji pattern, we should also focus on its shadows. Let’s discuss this below.
Doji candlestick types
The first classification approach is based on the advance made by either bulls or bears on a certain time frame. In this case, we are talking about a pattern that is not symmetrical.
Thus, if a candlestick closes above the opening level, this indicates the advantage of the buyers, although a very slight one.
This type of Doji is green or white.
Conversely, if the price has slightly dropped, the candlestick is considered bearish and is red or black in color. At the same time, experts note that the color of the Doji candlestick is of secondary importance.
An accurate Doji is neither bearish nor bullish as both open and close levels have matched.
The second classification approach is based on the length of Doji shadows which make it look like:
- a cross;
- an inverted cross;
- a plus sign
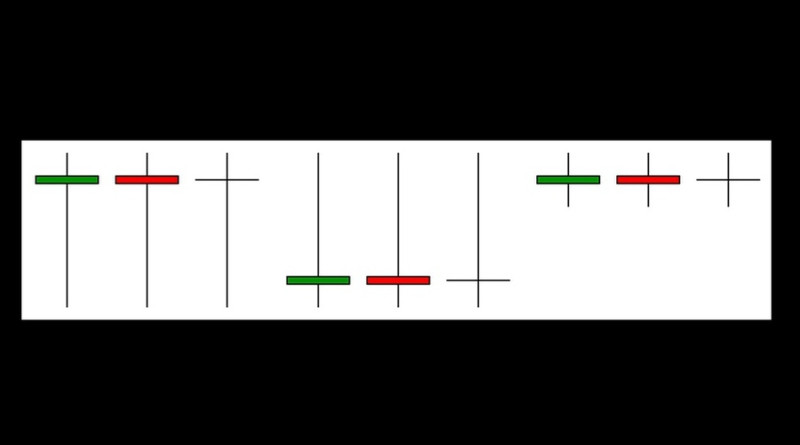
However, the most widespread classification considers candlestick bodies and
shadows together.
Therefore, the following types of Doji candlesticks are distinguished:
1. Long-legged Doji: its main feature is long upper and lower shadows. It is also called a Rickshaw Man Doji if its shadows are of the same length.
This Doji reflects a high level of uncertainty in the market together with high volatility. It may predict a trend reversal or a phase of correction.
Some experts believe that this pattern should be taken into account only when it is formed at the top of an uptrend.
2. Neutral Doji: compared to the Long-legged Doji, this type has shorter shadows of a similar length. This pattern resembles a plus sign (+) and is often called a Doji Star thanks to a similar shape.
This is the most common type of a Doji that can be observed in different assets.
Neutral Doji often serve as components of other patterns which is why they shouldn’t be used as a separate tool for getting trading signals.
Some experts see them as a separate type while others classify them as a variety of Long-legged Doji candlesticks.
In the screenshot below, you can see the difference between these two types of Doji as well as other patterns that we will discuss later.
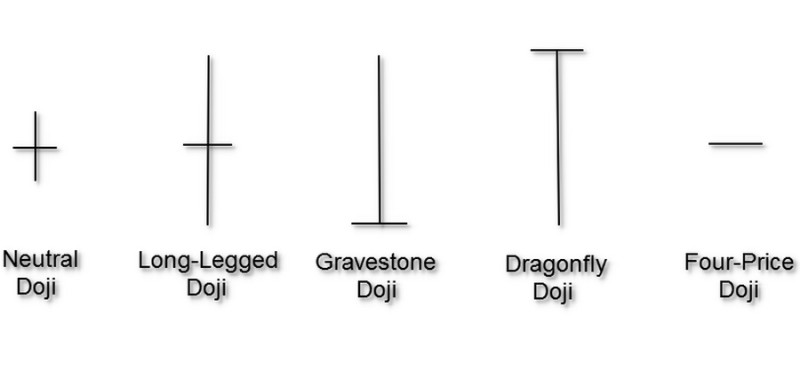
3. Dragonfly Doji: this pattern has a long lower shadow and a very small or a non-existent upper shadow. The resulting candlestick looks like a T letter.
It means that the open, close, and the high of the price were all at the same level in a given period. Sellers were active at the start of the session and managed to drive the price lower.
Yet, by the end of the session, buyers stepped in and pushed the price back to the opening level.
Most of the time, a Dragonfly Doji implies the reversal of the trend. If a Dragonfly Doji follows a long bullish candlestick during an uptrend, this could signal a potential reversal. During a downtrend, the same is true when the Doji follows a long bearish candlestick.
This pattern is especially relevant when it appears at the bottom of a downtrend.
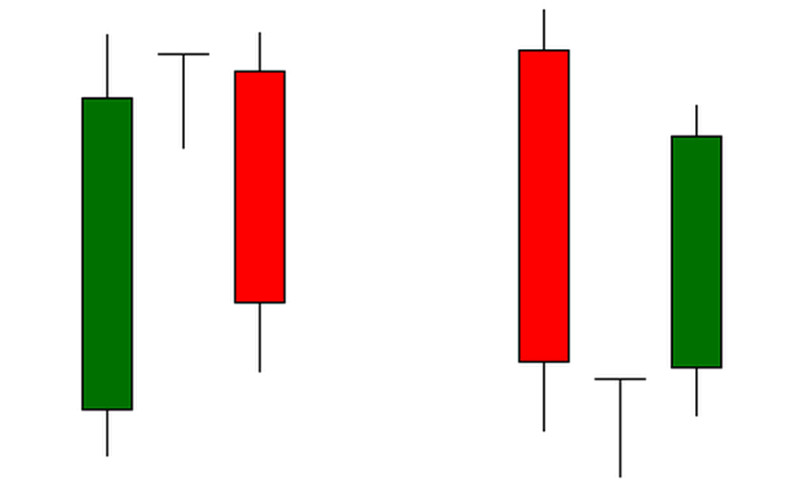
4. Gravestone Doji: this pattern is the opposite of the Dragonfly Doji which means that it has only an upper shadow while the lower shadow is very small or absent.
The Gravestone Doji can serve as a strong reversal signal during a downtrend if it is followed by a long bearish candlestick. The same is true for an uptrend when the Doji forms after a long bullish candlestick.
The signal is especially relevant when it appears at the peak of an uptrend.
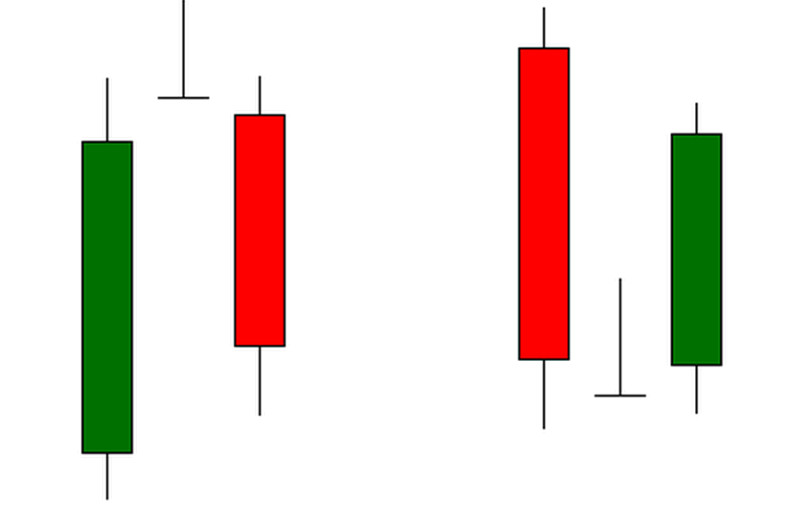
For both Dragonfly and Gravestone Doji, a confirmation of a reversal is required. For this, you should focus on the candlestick that follows the Doji.
It should be bullish before a potential bullish reversal or bearish if an uptrend is about to turn into a downtrend.
5. The 4 Price Doji: this pattern has no shadows at all. This means that all four price indicators (high, low, open, and close) are fully equal.
In other words, there were no changes in the price during the given time period. This happens very rarely and mostly during low-volume trading.
When this pattern appears, anything can happen: the price can reverse, continue the trend or start a correction. It is better to stop trading for a while as this Doji candlestick indicates a high level of market indecision.
Interpreting Doji
It is commonly believed that a Doji usually precedes a reversal. However, it is not always the case.
In fact, a Doji conveys the sense of indecision in the market. To foresee the next move of the price, you need to consider the following factors:
1. The surrounding setup. If a Doji appeared among other candlesticks with small bodies and long shadows, its relevance is minor.
Most probably, it indicates the consolidation phase that may continue for some time.
On the contrary, the surrounding candlesticks with long bodies should be deemed important, especially if they are located close to the resistance or support level;
2. The trend. If a Doji appears after a steady and well-pronounced trend, a reversal is very likely.
For a trend to continue, there should be a certain imbalance between trading forces. For the continuation of an uptrend, the demand should outweigh the supply, and vice versa for a downtrend.
Meanwhile, a Doji shows that the effort of both bulls and bears is almost the same or equal. This is a sign that the trend is losing momentum and may turn in the opposite direction at any moment.
As we have mentioned above, it is necessary to focus on the candlestick following the Doji in order to confirm or cancel a reversal. These three tips may help you understand whether there has been a change in the price direction:
- a Doji is followed by a candlestick with a long body. The pattern should be bullish if it was preceded by the downtrend or bearish if it was preceded by the uptrend;
- a Doji is followed by a candlestick that formed a gap in the opposite direction;
- the closing level of the candlestick following the Doji is way lower than the previous close in case of an uptrend or higher in case of a downtrend.
Now let’s discuss how to work with this pattern. As can be seen on the chart below, the asset is rising and reaching its highest value.
Then, a Doji appears, signaling that the market has entered a phase of uncertainty.
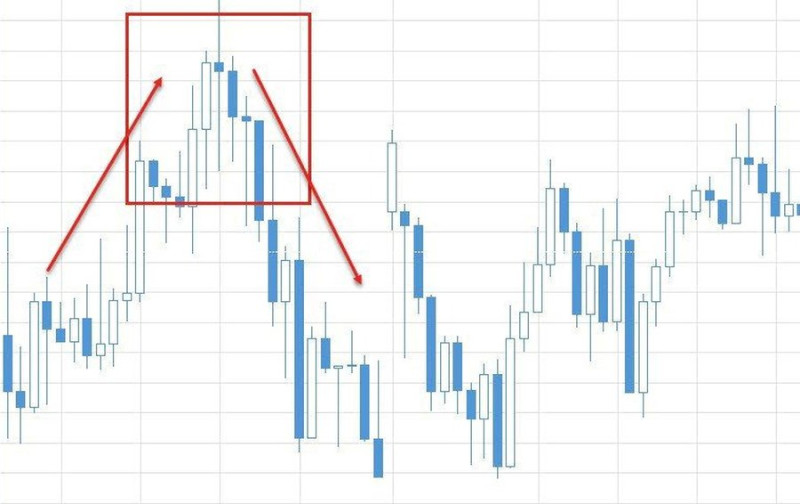
Judging by long candlestick shadows, there has been a tug-of-war between buyers and sellers but none of them could take over.
The Doji is followed by a bearish candlestick. This means that the quote has rebounded from the resistance level, thus confirming the reversal, and it will continue to fall.
As can be seen on the chart, the price has indeed headed for the downside.
So, when trading Doji, you should follow these steps:
1. Spot the pattern on the chart and define its type. Pay special attention to the parts of the candlestick (the length of its shadows and the way they differ from each other).
For example, the Gravestone Doji usually predicts the start of a downtrend whereas the Dragonfly Doji most often indicates a reversal to the upside;
2. Check the surrounding setup. If the pattern occurs at the top of the uptrend, the trend may reverse to the downside. If it appears at the bottom of the downtrend, an upside movement may be approaching.
You should also keep in mind patterns preceding and following the Doji. The latter serve as confirmation signals.
3. Open positions only when you see confirmation signals mentioned above. Use other technical indicators to confirm a change in the trend, such as the Moving Average, MACD, RSI, the Stochastic Oscillator, and so on.
If there is no confirmation on the chart, don’t rush to open new trades;
4. Set a Stop Loss and Take Profit as they are necessary in any trading strategy.
Pros and cons
Experts have different views about the relevance of using Doji when opening or closing positions. Some consider them an important tool of technical analysis, while others point out mixed signals these patterns may generate.
Advantages:
- Doji can be used on different time frames starting from the H1 chart;
- Easy to spot: a Doji is easy to find on the chart, and even newcomers can do this;
- It can be applied to different assets;
- It generates signals for entering the market.
Disadvantages:
- A Doji itself does not guarantee that a trend will reverse. It always needs to be confirmed;
- A Doji may be confused with the Spinning Top pattern;
- Signals provided by the pattern can be mixed. It is better to use it as part of more complex patterns or together with other technical indicators.
As we can see, the Doji candlestick can be really helpful in trading. It helps detect a trend reversal in time, making the trading process more effective.
All this is true provided that you have correctly identified the pattern.
However, a Doji shouldn’t be the only pattern you rely on. Such an approach can be quite risky.
Complex Doji patterns
To open a trade in the right direction and time, you need to predict the future trajectory of the price. A Full guide to reversal and continuation trend patterns covers the topic of forecast methods.
We have already mentioned that a Doji usually indicates an upcoming reversal if supported by confirming signals.
In fact, these Japanese candlesticks can be used separately. However, their relevance increases if they make up a more complex pattern.
Let’s explore major patterns with a Doji:
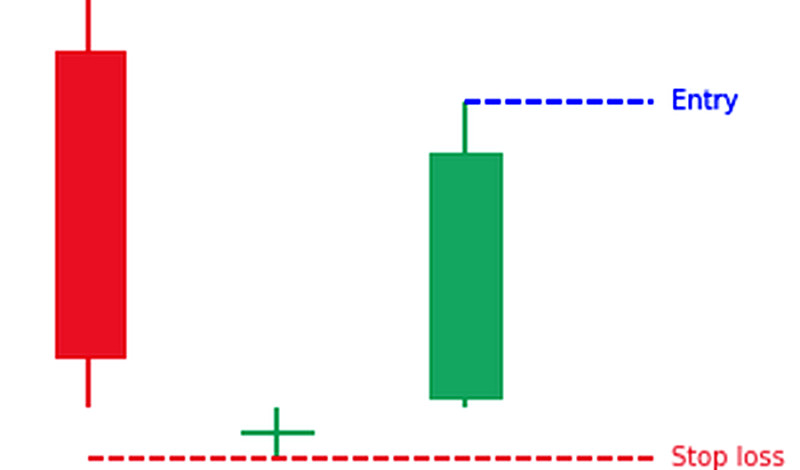
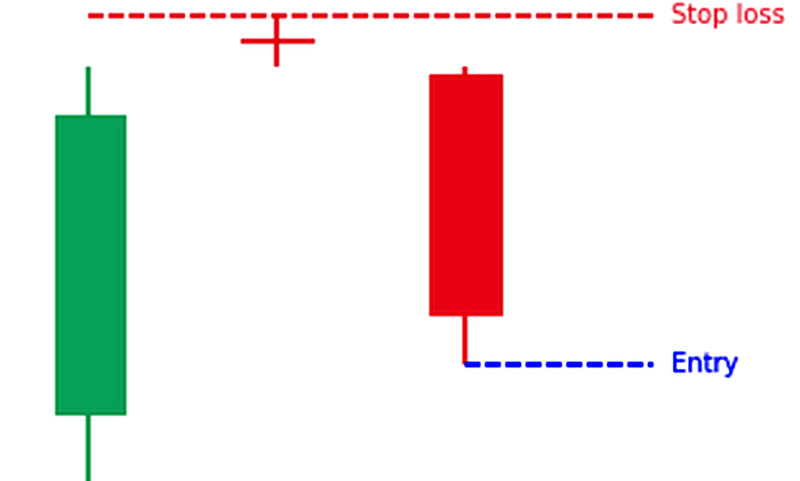
1. The Doji Star pattern consists of three elements. The first one is a candlestick with a long body that represents the main trend. The second one is the Doji itself. Finally, the third element serves as confirmation.
This pattern can appear at the top of an uptrend or at the bottom of a downtrend. It indicates that a trend reversal is near.
This chart formation can be either bullish or bearish.
A bullish, or a Morning Doji Star, is formed in the bear market and signals a possible change in the trend. A long bullish candlestick acts as proof supporting the reversal.
A bearish, or an Evening Doji Star, shows up in the bull market. A long bearish candlestick, the last element of the pattern, confirms the start of the downward movement.
These patterns help traders avoid wrong positioning of the trades when they are opened against the trend;
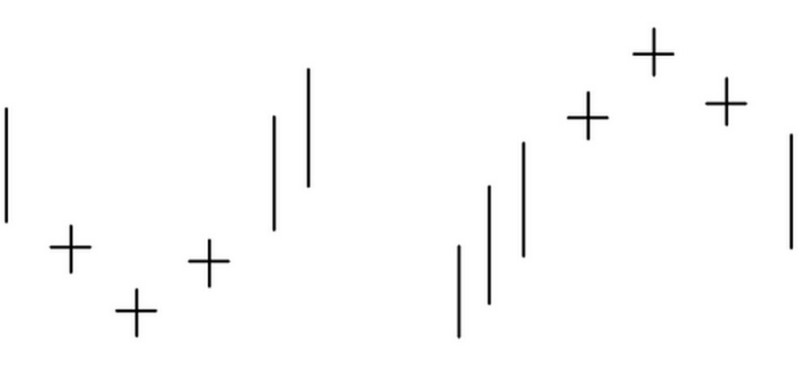
2. A Tri-Star Doji is a reversal pattern consisting of three parts. The formation is characterized by a strong signal.
If a Tri-Star Doji appears at the top of the uptrend, this is a signal of a bearish trend reversal. If it occurs at the bottom of the downtrend, the market will soon become bullish;
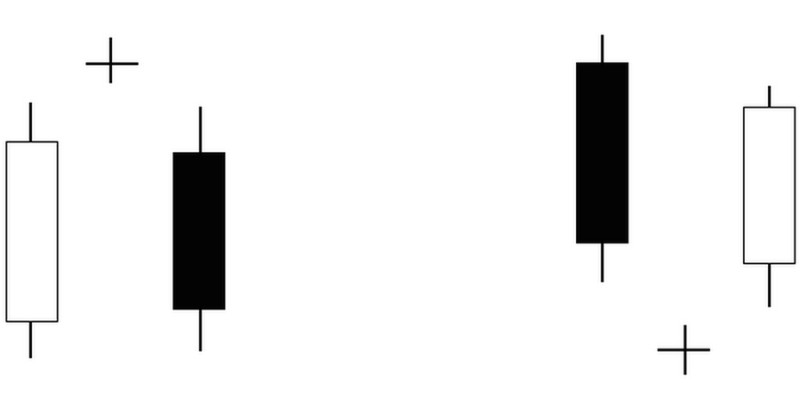
3. The Abandoned Baby Doji pattern is a subtype of the Evening Doji Star. It also appears at the bottom of the downtrend or at the peak of the uptrend and signals a reversal.
Yet, all the elements of the pattern are divided by a gap that distinguishes the Abandoned Baby Doji from other patterns.
4. The Harami Cross is a Doji pattern that can be either bullish or bearish. It suggests that the previous trend is about to reverse.
The bullish pattern consists of a downward candle and a Doji that is completely contained within the prior candlestick body.
The bearish Harami Cross, on the contrary, starts with an upward candle.
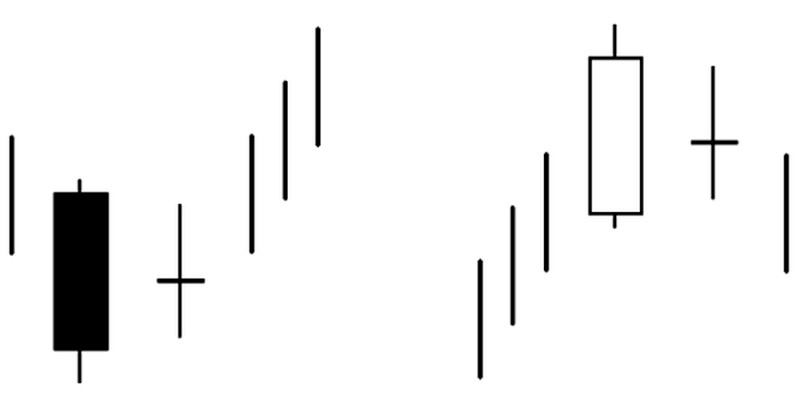
We have discussed just a few composite patterns that include Doji candlesticks. In fact, they already contain an element that acts as the confirmation of a trend reversal.
Things to note
The Doji candlesticks are quite easy to spot on the chart. Yet, this is not enough for effective trading.
Below, you will find some useful tips on trading Doji:
- Doji shouldn’t be used during a sideways movement as their signals might be confusing;
- Importantly, a Doji should be preceded by a well-pronounced trend. The pattern usually occurs at the bottom of the bear or at the top of the bullish market;
- The relevance of the signal increases if a Doji appears near support or resistance levels;
- If you use a Doji separately outside of a complex pattern, it is necessary to wait until a reversal is confirmed. You can open trades only after the formation of a candlestick that is opposite to the previous trend;
- If there are too many Doji patterns on the chart, simply ignore them. Remember that a Doji is relevant only when it appears next to a candlestick with a long real body;
- Doji is more suitable for forex trading rather than stock trading. The thing is, they are much less common on Forex which makes their relevance more significant;
- When trading Doji, it is better to use time frames not lower than H1;
- A reversal signal is considered stronger if it is confirmed by large trading volumes;
- When appearing during an upside movement, the pattern indicates that the trend is nearing its peak and is about to reverse. In the case of a downtrend, the price may either reverse or continue to fall. You need to look for confirmation signals;
- If you trade Doji as a reversal pattern, a Stop Loss can be set above the shadow. A Take Profit should be placed at the support level when selling and at the resistance level when buying the asset;
- Use higher time frames to look for confirmation signals;
- The likelihood of a reversal is higher if the preceding candlestick and the Doji are divided by a gap.
Final thoughts
Traders tend to build their own set of technical tools to facilitate trading. Among such tools are Japanese candlesticks which are very diverse.
“How can a Doji be useful if it is actually a neutral pattern?” newcomers may wonder when they consider whether to use it or not.
Remember that market uncertainty shows indecision of both bulls and bears. Most often, it means that the two forces are equal.
Keep this fact in mind as it is the basis that forms the continuation or reversal of the trend.
Main things to consider when trading Doji:
- Make sure there is a clear and strong trend that continues for a long time;
- Check if the pattern is preceded by a candlestick with a long real body formed in the direction of the trend;
- Look for confirmation: a pattern following a Doji should have a long body opposite to the original trend.
If all the requirements are met, you can safely use Doji for opening positions. To start trading, choose either a demo or a live account with InstaForex.
Read more:
Triple Bottom Reversal Pattern
Full Guide to Double Top Pattern
Diamond Chart Pattern in Technical Analysis
Full Guide to Head and Shoulders Pattern
Full Guide to Wedge Chart Pattern
Flag Pattern in Technical Analysis
How to use Cup and Handle Chart Pattern
How to use Pennant Chart Pattern
What is Gap in FX and Stock Trading
What is Dividend Gap and when is it formed
Japanese Candlestick Patterns in Technical Analysis


 Back to articles


