


Make your trading more engaging and profitable. Add the article Full Guide to Main Technical Chart Patterns to your reading list and learn everything about other patterns.
Today we will explore the pennant price formation. Find out how to identify it on the chart and what to look for when trading it.
What is a pennant?
In technical analysis, patterns are graphical formations created by the price movement on the chart. Traders may detect them on their own or may use special indicators.
After recognizing a pattern, traders can predict the next move of the price and open a trade at just the right time in the right direction. That is why it is so important to identify a pattern correctly.
Most commonly, patterns are classified as:
- continuation trend patterns: indicate that the current trend will go on;
- reversal trend patterns: predict a change in the current trend.
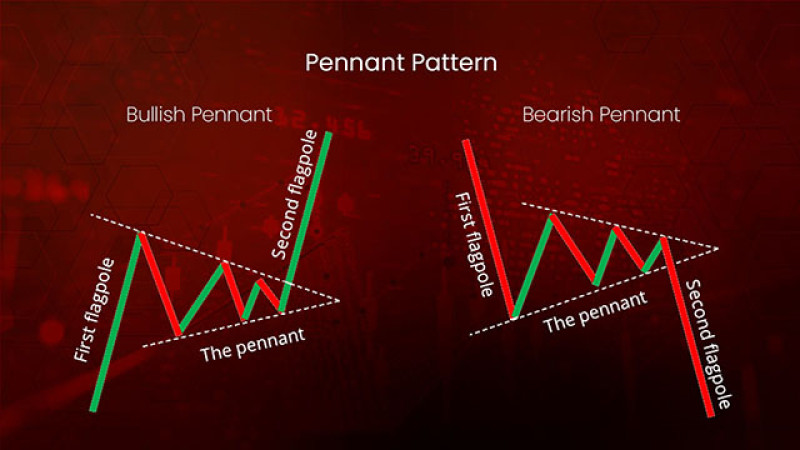
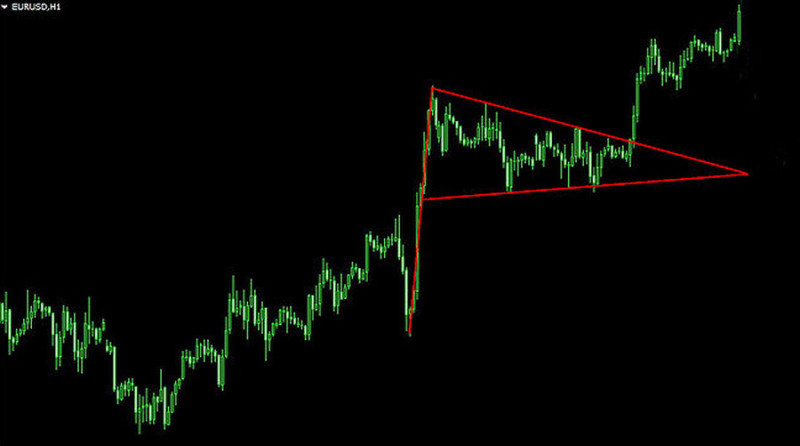
A pennant is one of the most popular and reliable types of continuation patterns. It looks like a horizontal or symmetrical triangle with a so-called flagpole above or below it.
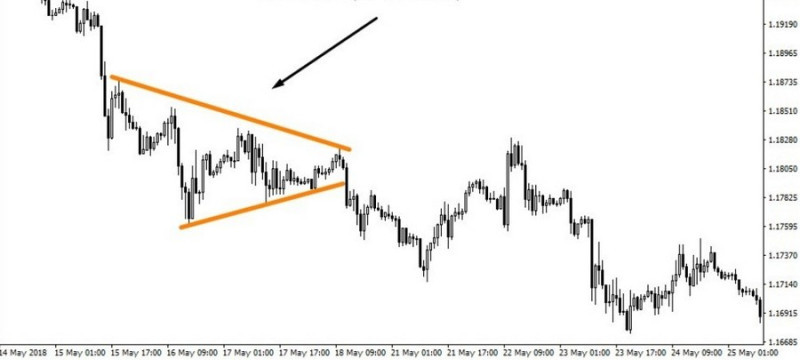
Have a look at the pennant formed on the EUR/JPY chart below.
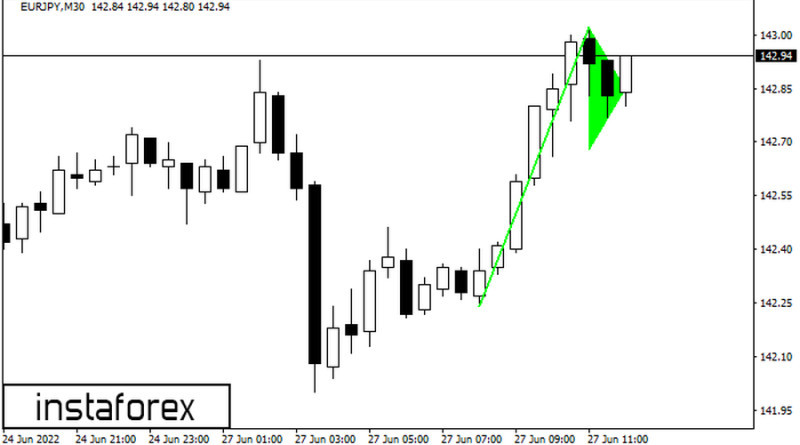
A flagpole consists of one or several candlesticks formed by a spike in the price. The body of such candlesticks is usually rather long.
At the next stage, the asset is trading flat for some time and the quotes are fluctuating within a price channel that is steadily narrowing to form a triangle.
Trading volumes inside the triangle are usually low and the fluctuation rate is decreasing. This is when the trend pauses for a while.
After the pattern has been completed, the price continues to move in the previous direction. In other words, when going through a triangle, bulls have won if the asset was moving up or bears have maintained control if the asset was moving down.
What you need to know about pennants:
- a flagpole is a distinctive part of a pennant as it represents a sharp rise or a fall in the price. This is what makes it different from other patterns such as a triangle;
- a breakout from the pattern comes after the price has tested the lines of the channel several times. As a rule, it tests the boundaries of the triangle five to seven times before breaking out;
- the pennant pattern has to be preceded by a strong upward or downward trend. Do not look for this pattern during a flat movement;
- usually, the pattern forms faster during a downtrend than an uptrend;
- this is a short-term formation that is commonly observed on intraday time frames;
- it tends to appear in the middle of the current trend;
- trading volumes go up when a flagpole appears and when the price breaks out of the pattern;
- when the pattern is complete, the distance that the price will cover following the main trend usually equals the length of the flagpole.
You need to keep these things in mind to identify the pattern correctly and use its signals efficiently.
Types of pennants
If you take a close look at the pennant’s structure, you can see that its body can be located strictly horizontally or can be slightly angled. So, a pennant can be of two types:
1. A horizontal pennant is formed when a flagpole consists of one or two candlesticks;
2. An angled pennant is formed when a flagpole consists of many candlesticks and its body is not strictly horizontal.
Another classification is based on the trend that preceded the pennant. As we have already mentioned, a pennant indicates the continuation of the trend.
There are two types of pennants:
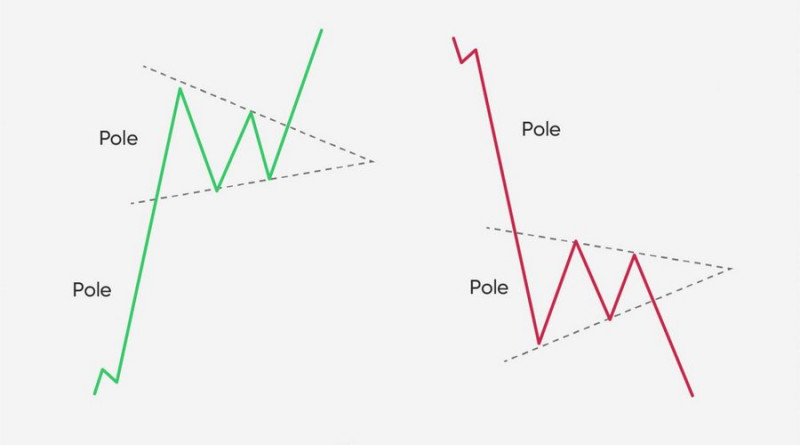
- a bullish pennant means the prevalence of the uptrend. In this case, the body of the pennant is located on top of the flagpole. After a breakout, the price keeps moving in the same direction as the prior uptrend;
- a bearish pennant signals the continuation of the downtrend. Its main body is found at the bottom of the flagpole.
These two types mirror each other, and a bearish pennant is sometimes called an inverted pennant.
In both cases, the price breaks out of the converging lines of a triangle after completing consolidation. The consolidation phase usually comes to an end when the two lines cross and form an apex.
Right after a breakout, the price surges to the upside or the downside depending on the trend.
How to trade the pennant pattern
A pennant proves that the ongoing trend has enough strength to continue. Most likely, the price will accelerate after completing the pattern.
Traders need to keep this fact in mind to determine the entry point and the price direction.
A bullish pennant implies going long because the price will eventually continue to rise.
If you see that a bullish pennant is forming, follow these steps:
- Wait until the price breaks through the triangle and the candlestick closes outside of the pattern;
- Evaluate trading volumes: they tend to increase during a breakout;
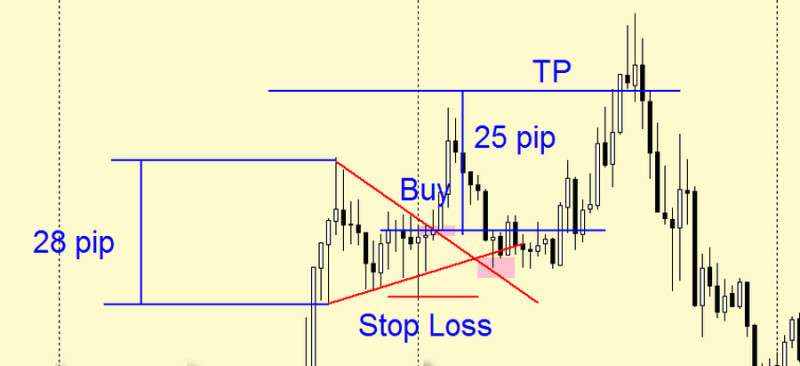
- To set a Take Profit, apply the initial flagpole’s height to the breakout point. Some traders prefer to shorten the distance by 30% to be on the safe side;
- Set a Stop Loss below the triangle’s low. This will back you up in case the price makes an unexpected move.
Keep in mind that trades should be opened only in the direction of the trend that preceded the pennant. In case of a reversal, it is better to hold on for a while as this could be a correction coming.
The steps are the same for the bearish pennant, with the main difference being that you need to go short on the asset.
Please take notice of the distance between the breakout candlestick and the resistance level. If the distance is short, feel free to open a trade.
However, if the candlestick is located too far from the broken resistance line, it is better to stay out of the market for some time. The best solution will be to wait for the price to retest the level.
The strategy described above is a conservative one. It minimizes the risks and offers clear guidelines intelligible to newcomers.
Some traders prefer a more aggressive approach which implies entering the mark at a very early stage or in the process of the pennant formation. That is, such traders do not wait for the price to break out of the triangle.
They open sell or buy trades at one of the levels of the triangle, depending on the trend direction. Positions are then closed when the price is approaching the opposite level.
This strategy carries risks and the whole process requires a trader to be very skillful.
Trading tips
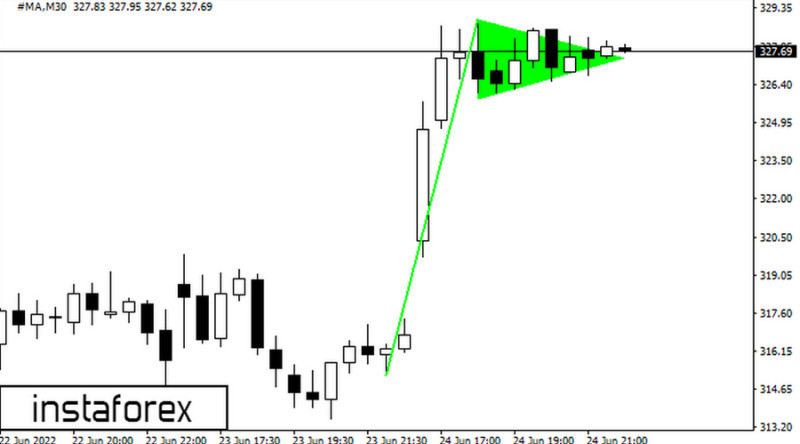
When trading a pennant, it is worth monitoring trading volumes. As a rule, volumes increase at the start of the formation and right after a breakout.
In the consolidation phase, trading volumes decline as shown on the chart below.
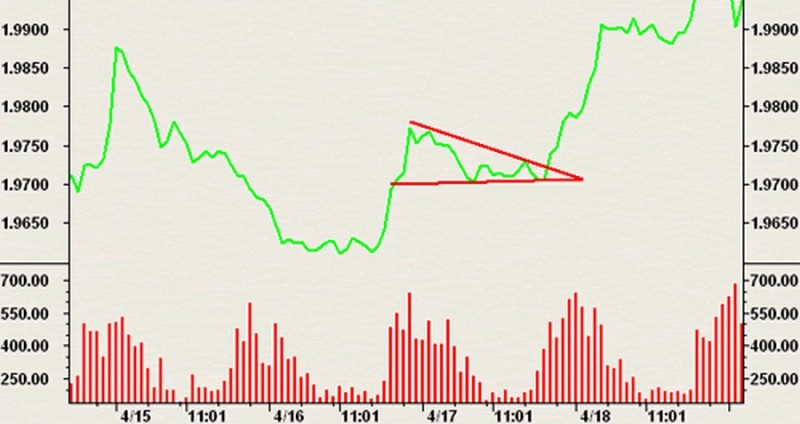
So, if the price breaks out of the pattern and volumes go up, you have a good chance to open a successful trade. This proves that the previous trend is gaining momentum.
Additionally, you can use Fibonacci levels to confirm the signal.
Recommendations:
- to see more price changes, check the asset on a lower time frame;
- to confirm the pennant signals, apply other technical tools mentioned above;
- beginners should avoid opening trades at the very start of the formation. It would be wiser to wait for its completion or a breakout;
- It is always necessary to set a Take Profit and a Stop Loss. The target should be established at a distance equal or close to the height of the flagpole adjacent to the triangle;
- stick to your trading strategy. No matter how attractive a potential trade may look, always remember the risks that it may carry;
- refrain from opening a trade if you doubt it. For example, if you see that trading volumes are falling instead of rising, take it slow and wait for a better entry point;
- although a pennant is a very common pattern, it does not guarantee that all your trades will be profitable. So, do not blindly open a trade just because you see this pattern on the chart
To be more confident with a pennant, get confirmation from other technical tools and stick to your trading strategy.
You can open a position with either a market or a pending order. In the second case, you will not have to watch the quotes because the order will be activated automatically upon reaching a certain price level.
When trading manually, you need to wait for the moment when the price leaves the pattern, that is, the candlestick closes beyond the pennant’s body.
With a pending order, you can set a target above the supposed breakout level at approximately 10-15 pips.
As was mentioned above, set a Take Profit at the height of the flagpole and place a Stop Loss below the triangle.
In a bearish pennant, trade in the opposite manner.
Pennants and other patterns
This article is devoted to a particular technical chart pattern. To explore other price formations, read the article Full Guide to Reversal and Continuation Patterns.
Now let’s discuss the difference between a pennant and other patterns that may look alike at first glance. This way, you will know how to detect a pennant more accurately and, therefore, trade it more efficiently.
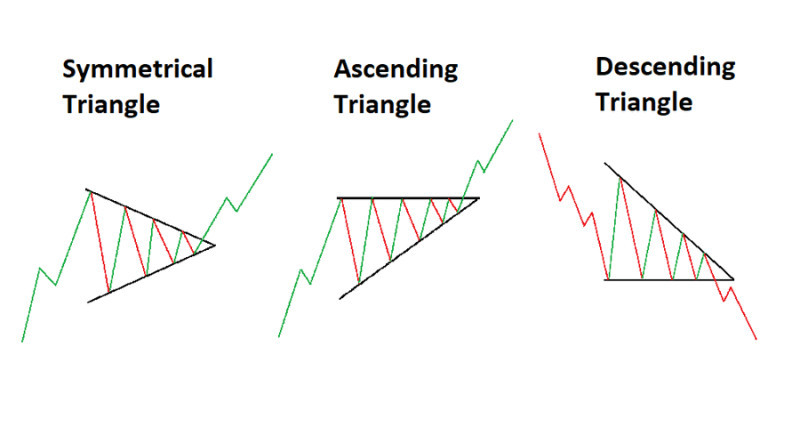
Most of the time, traders, especially beginners, compare a pennant to a wedge pattern or a triangle. A wedge and a triangle are very similar but a wedge has two lines angled in a specific manner that no other pattern has.
The distinctive part of a pennant is a flagpole formed by a rapid price movement. Neither a wedge nor a triangle has such an element.
Pennant vs triangle:
- A pennant starts with a strong price movement either up or down;
- A triangle forms over a longer period of time. It is a long-term formation;
- In the case of a pennant, a correction usually takes no more than 40% of the flagpole’s height. In a triangle, a correction is much deeper.
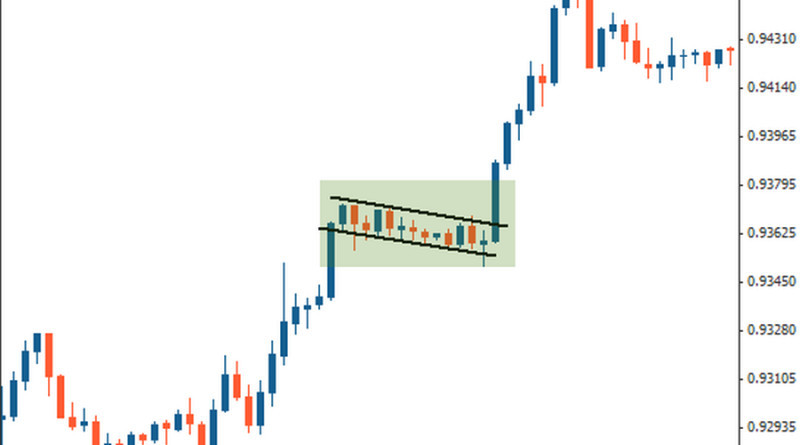
A flag is another pattern that is often confused with a pennant. Both patterns belong to a continuation category and can appear in bullish and bearish markets. They both serve as reliable signals to go short or long.
However, in a flag, the lines are not converging into a cone, they stay parallel. This is the main feature that distinguishes a flag from a pennant.
What to keep in mind when trading pennants
None of the technical chart patterns can guarantee you profit.
A pennant is a continuation pattern which is why it is natural to trade in the direction of the trend but not visa versa.
Besides, there are other aspects that you need to focus on when trading a pennant:
- A formation detected on a time frame lower than М15 should be used with caution as it is highly unreliable;
- A pennant has to be preceded by a strong well-pronounced trend. In case of deep pullbacks, the emergence of a pennant is very unlikely;
- If the price goes through long and numerous pullbacks inside the pattern during a correction, then it will take longer to form a breakout;
- By contrast, if the price fluctuates in a sharp and quick manner, this means that a breakout will be rapid as well;
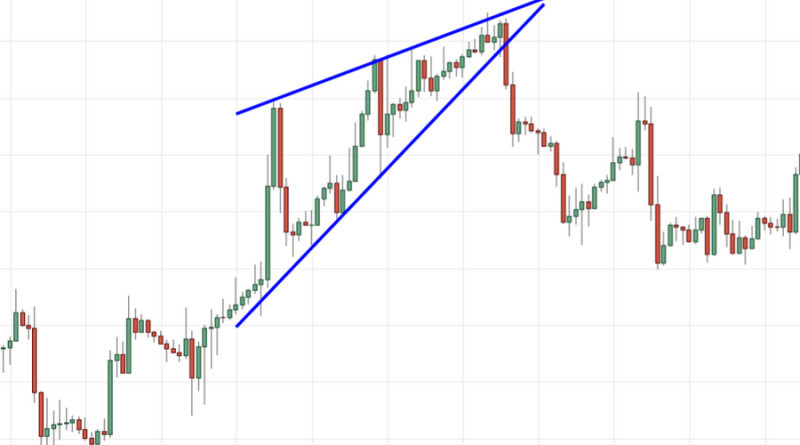
- Several waves inside the pattern do not necessarily mean that you are dealing with a pennant. You should see at least 3-4 waves between the lines that are converging.
The highs and the lows of the waves can be used to set trendlines. If inside the channel, the price behaves not like it is supposed to, you can be dealing with a different chart pattern.
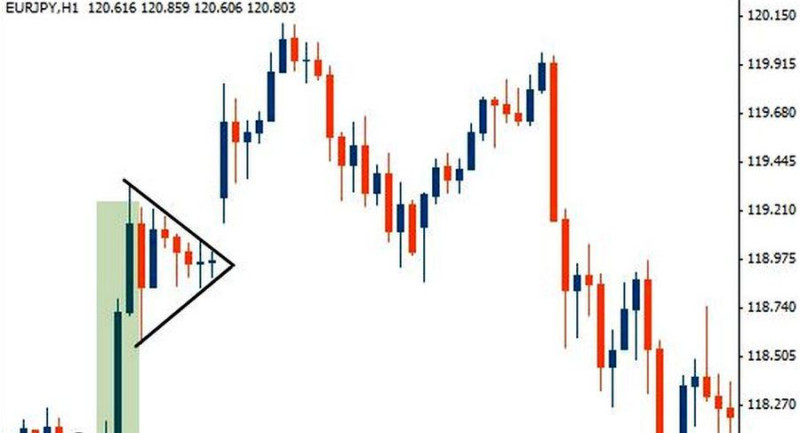
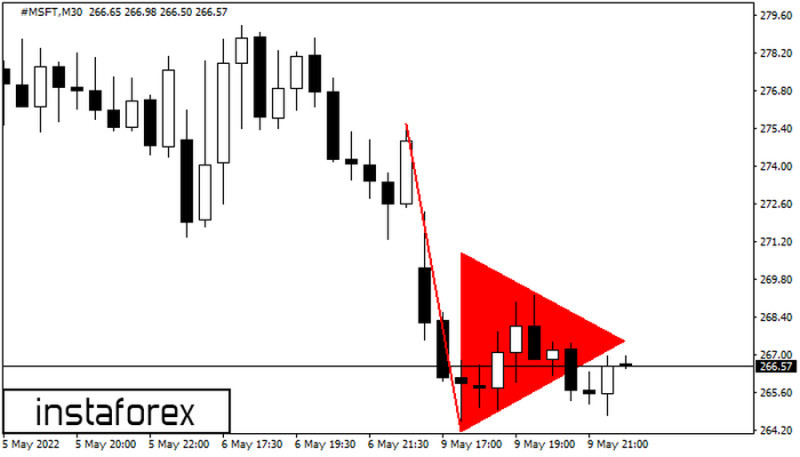
Below, you can see a pattern that looks similar to a pennant but belongs to a different category.
If you are not sure whether you have identified a pennant correctly, it is better to stay out of the market.
Conclusion
A pennant is a simple and easy-to-use chart pattern that helps define the best entry point. Besides, its visual representation is rather straightforward as it displays the trajectory of the asset’s price.
Therefore, this pattern is a good tool for both beginners and experienced traders. However, novice traders need to be careful when searching for this pattern on the chart and interpreting its signals.
It is essential to keep in mind that this formation emerges only amid a strong existing trend and serves as a continuation signal. The price will continue to move in the previous direction after finishing consolidation and gaining new momentum.
Despite the ease of use, you should not forget about risk management when using this strategy. Find out more about effective trading on our website.
If you are new to Forex, try your hand at trading with an InstaForex demo account. Then you can be more confident when trading live.
Read more:
Full Guide to Triple Top Pattern
Full Guide to Triple Bottom Pattern
Full Guide to Double Top Pattern
Full Guide to Diamond Reversal Pattern
Full Guide to Head and Shoulders Pattern
Full Guide to Wedge Chart Pattern
Flag Pattern in Technical Analysis
How to use Cup and Handle Chart Pattern
What is Doji candlestick and how to use it
What is Gap in FX and Stock Trading
What is Dividend Gap and when is it formed?
Japanese Candlestick Patterns in Technical Analysis
Full Guide to Double Bottom Pattern


