


In the financial markets, prices are constantly moving and sometimes we can see gaps on the charts. This article reveals everything you need to know about gaps and how you can use them in trading.
If you want to learn more about trading, read the article Technical analysis patterns: basic and reversal. Read our articles to make your trading more effective.
What is gap
If you are familiar with chart trading, you may have noticed that sometimes a break between neighboring Japanese candlesticks or bars appears on the chart.
This means that the price of an asset usually moves gradually up or down. However, at some point, it moves sharply up or down, with no trading in between.
This is the gap. It represents a hollow space between the neighboring candlesticks. On the chart it looks like a piece of a jigsaw puzzle is missing.
A gap can move:
- up, when a new candlestick is higher than the previous one having some space between them. In this case, the price increases;
- and down. Here we can see the opposite picture. A new candlestick is lower than the previous one.
You can see an example of the price gapping up below.
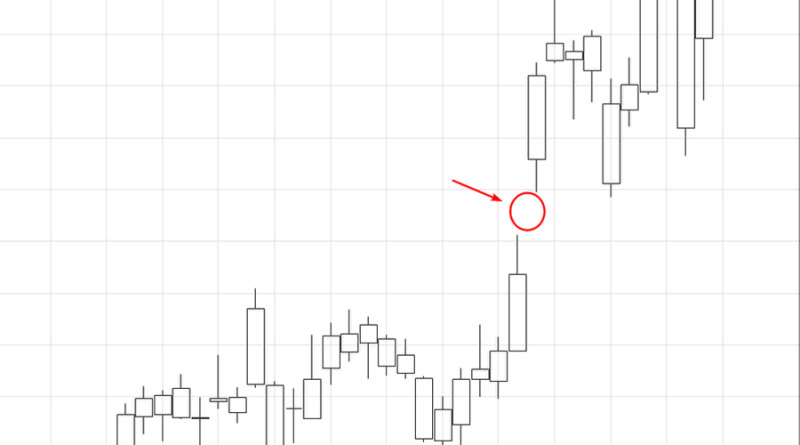
For example, the EUR/USD pair is trading at 1.0304 but then it sharply jumps to 1.0504. The space in between the candlesticks is a gap.
A gap may occur:
- on stock exchanges;
- on cryptocurrency marketplaces;
- on Forex;
- in futures and commodities markets.
Importantly, a gap cannot be seen on a line chart because the line connects only the closing prices. In this regard, Japanese candlesticks give more information because they reflect not only the closing price but also the opening one.
If there is a gap between the closing and opening prices, it will be clearly represented on the chart.
Meanwhile, it is wrong to believe that the gap appears on the chart of any asset and on all time frames. On the contrary, it occurs rarely in most cases.
However, the gap in trading is always around the corner. Otherwise, all financial markets would be very predictable. This should be taken into account to avoid disappointing situations in trading and to make your trading plan correctly.
This applies to both beginners and experienced traders.
Why gap appears
If you want to use gaps in trading correctly, it is important to understand why they occur. There are three situations when a gap may appear:
- breaks between trading sessions. For example, the forex market operates 24/5. On weekends, some events may significantly affect prices.
This means that the price can rise or fall relative to previous values at the beginning of the market hours. In this case, the chart will show a gap.
Stock exchanges also have their working hours. When there is no trading on them, the quotes may also change as well.
- order to keep track of the situation and predict changes, we recommend periodically studying the Economic Calendar, as well as the InstaForex news section;
- market behavior. Quite often, there are ambiguous situations in the markets when traders are afraid to make trades.
When the situation becomes less ambiguous, we can see soaring liquidity. The price may go up or down depending on traders’ commitment.
Notably, a gap always occurs when the bid and ask are imbalanced. The quotes rise when the ask price is considerably lower than the bid price. Conversely, the quotes fall if otherwise happens.
How can we forecast a gap? It is easier to predict the gap when the market is not operating.
As for the fundamental factor, predicting a gap is more difficult. Here everything depends on how unexpected the news is and whether a trader correctly determined their influence on the quotes.
Another important thing to take into account is when the gap is filled. This is the period during which the price returns to the level that it was before the gap.
First of all, this filling occurs sooner of later. Sometimes this may take months or years.
Most of the time, this may take place in stock markets. Imagine that a company’s stocks gapped down and could not recover because of the company’s poor performance.
However, such a situation occurs rarely.
There are no detailed statistics on this matter but experts note that sometimes it is difficult to close news gaps. On the other hand, dividend gaps, which we will describe below, are filled almost every time they appear.
Secondly, traders can benefit from gaps and their filling. The main thing here is to use them properly.
Classification
We have already discussed that the price may gap up or down. Apparently, there is a broader classification for gaps.
Gaps can be classified into the following types:
1. Common gaps are the most frequent. They represent little change in value and tend to fill themselves quickly.
This type of gap is usually used for short-term trading.
Below, there is a currency pair chart. In this case, the price returned to the initial level during the trading day.
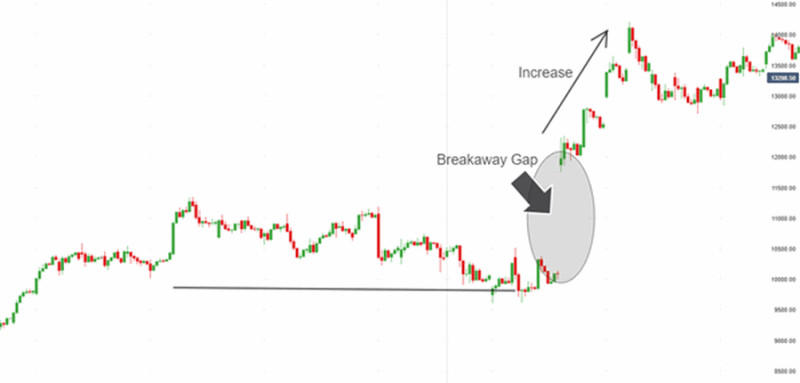
2. Breakaway gaps. The price continues to move in the direction of the gap. For example, if the price gaps up, it continues to rise. On the contrary, if the price gaps down, the quotes continue to decline. As a rule, the price is moving within a strong trend after the breakaway gap.
The main sign of such a gap is a break in the price level, which most often occurs against the background of the consolidation that preceded it. This happens when whales enter the market or important economic events occur.
3. Continuation gaps, also known as runaway gaps, occur when the price is trading within a strong trend and signals that the trend will continue.
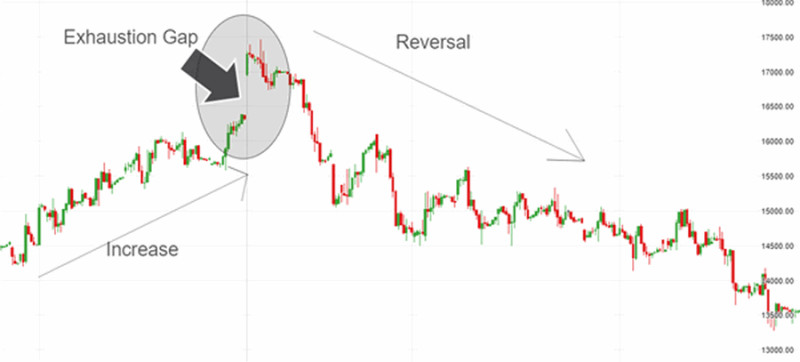
4. Exhaustion gaps happen when the trend is losing strength and it is likely to reverse.
The main difference of this type of gap lies in a continuous price movement according to the trend that preceded the gap.
It is important to define the type of gap before you start using them in trading. Depending on the gap type, one should consider their trading strategy.
Gap on exchange
An exchange is a marketplace where assets are traded. Sellers and buyers meet in order to make profitable trades and increase their capital.
Types of exchanges:
- stock exchanges allow traders to buy or sell stocks and securities that many companies offer there;
- commodity exchanges offer precious metals, oil, agricultural commodities as well as other assets for trading;
- currency exchange designed to trade currencies. It is important to understand that Forex does not refer to currency exchanges because it is an over-the-counter platform;
- cryptocurrency exchanges offer traders to buy and sell cryptocurrencies.
Gaps occur on each of the above exchanges, and in each case, they differ from each other.
For instance, there are several reasons why gaps can appear on crypto exchanges:
1. Low liquidity of coins.
Imagine that a new crypto asset is listed on an exchange. It is little known to anyone. In this connection, traders do not rush to invest in this asset.
As a result, orders are not reflected at all price levels. When they do appear, a gap is formed on the chart.
2. High value of the asset at a small price step. Here we are talking about the fact that the orders are present only at some price levels.
However, most often the gap is found on the stock exchanges. Each of them has an operating time during the day, and, as a rule, new trades start with a gap from the previous price.
Gap characteristics on stock exchanges:
- appears regularly, for example, every day or every other day;
- can be observed both on the charts of securities and stock indices;
- is the rule rather than the exception. That is why it should be kept in mind when developing a trading strategy;
- is characterized by a small decrease or increase in the price, that is, strong deep gaps in trading appear rarely;
- in addition to the time between trading sessions on stock exchanges, it may also be caused by economic events and news.
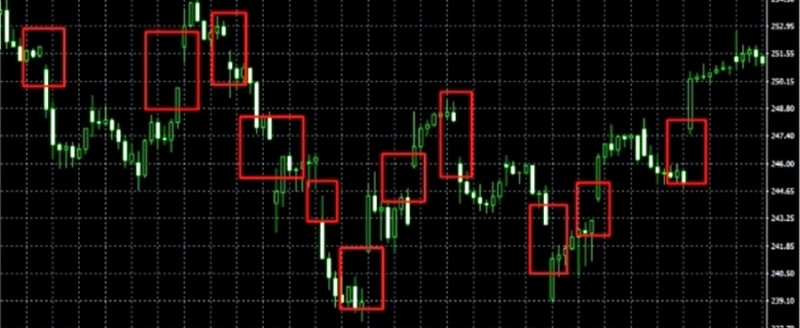
On the Microsoft stock chart, you can see session gaps. The gaps occurred 11 times during the 15 working days on the hourly time frame.
Quite often such sessions can also be observed on commodity exchanges. However, the dividend gap, which we will talk about below, is a unique event on stock exchanges.
Gap in stock trading
Now let's focus in more detail on the gap that occurs on the stock charts. Above we have already told that its appearance can be influenced by both stock exchange schedules and fundamental factors - news, important statements of politicians, etc.
A dividend gap is one of the types that may occur in stock markets:
It has the following characteristics:
- It shows that shareholders received dividends
- The price always gaps down
Let’s take a closer look at this type of gap.
Almost every big company pays dividends to its shareholders. The size of payment may vary and depend on the company’s financial performance.
When the company's statements go public, demand for its shares rises. In this connection, shares also increase in price.
This happens due to the fact that traders want to own shares to receive dividends.
On a certain day, the list of shareholders who receive dividends is formed.
Those who are on the list will receive dividends, and those who did not have time to purchase shares before that date will not receive payments.
After the payout day, the demand for securities falls sharply and the quotes drop. Thus, a dividend gap is formed.
Sooner or later, it also comes to an end. As a rule, the period during which it happens depends on the following factors:
- Depth of the fall. The more the value has fallen, the longer it will take to return to the previous quotes;
- The result of the company's performance. Shares of successful corporations are always in high demand, and the higher it is, the more confident the price rises;
- The size of future dividends. Solid payments in the future also increase the attractiveness of the securities, in addition, some companies pay dividends several times a year;
- Macroeconomic and political environment. When it is favorable, quotations grow faster; when there are negative trends, securities take longer to recover.
This type of gap is the most predictable one. A trader can learn the exact date of its occurrence.
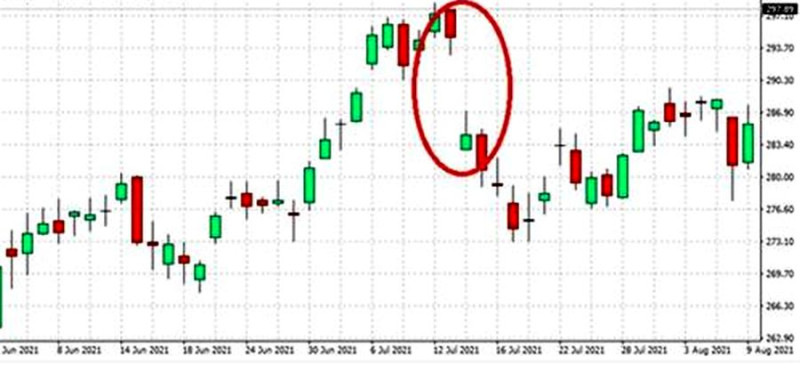
The chart shows the dividend gap on the Gazprom stock chart. The gap was formed after the payout in July 2021.
Gap on Forex
When it comes to the forex market, gaps do not occur so often compared to the stock market. As a rule, one can see gaps after weekends. As we know, the forex market does not operate on Saturdays and Sundays but some events, happening during these days, may lead to a gap.
The news may become such a factor.
Here are some characteristics of a gap on Forex:
- it happens rarely. Statistics show that only a few gaps may appear on the forex pair chart in half a year. However, it depends on a currency pair.
- it is more common among currency pairs that do not include the US dollar, as well as among exotic pairs;
- has significant depth, sometimes it can be hundreds of pips.
Experts agree that it is much harder to foresee news gaps on Forex than in the stock market. Nevertheless, it is possible to analyze the reasons why they happened in the past.
The main reasons are:
- The pandemic, major natural disasters, armed conflicts between countries;
- Changes in central bank policy, important decisions made by regulators;
- Macroeconomic events and news in the economic calendar.
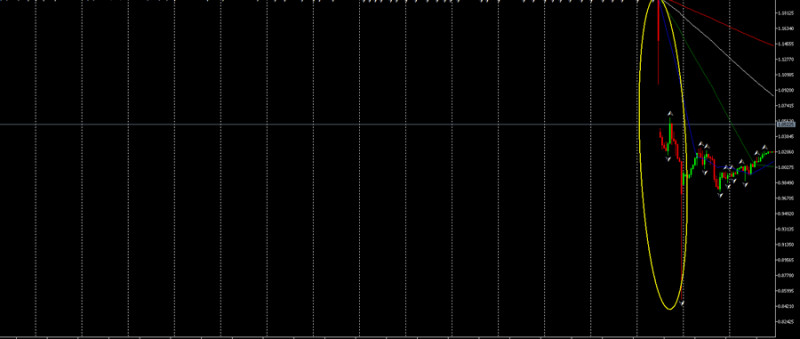
A vivid example of the news gap in trading could be observed in early 2015 on the chart of the euro/Swiss franc pair. At that time, the Swiss regulator canceled the minimum exchange rate cap that had been in effect since 2011.
As a result, in one trading day, the euro has fallen in value against the Swiss currency by almost 30%.
So, on Forex, the appearance of a gap is not a rule but more like an exception. However, it can be beneficial on Forex as well.
How to find gap on chart
We have told you about the gap in trading, and now we will discuss how to find it on the chart. Mostly, gaps are easy to see but sometimes they are not so obvious.
One can do the following to identify a gap:
1. In your trading platform, go to the data window in the View menu, then click on the previous candlestick and see the price at which it closed;
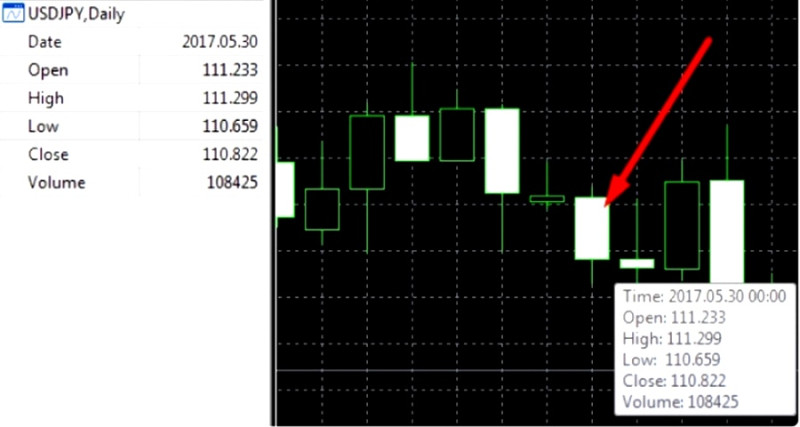
2. Using the same way, it is necessary to find out at what price the next candlestick opened. If the first and second prices are different, we can talk about a gap.
Importantly, there are no specific requirements for a difference in the prices. The main thing is that it should exist.
When the space between two candlesticks is shallow, the gap is almost invisible on the chart. Such a gap in trading is called “hidden.”
One can see hidden gaps on lower time frames.
If the price has changed significantly, the gap can be seen even on higher time frames.
Anyway, if you are not sure if there is a gap on the chart or not, you can always compare the prices of two adjacent candlesticks in the trading platform’s data window.
Importance of trend
The direction of asset price changes is very important when trading with the price gap. How to determine the trend is explained in the article Complete guide to trend reversal and continuation patterns.
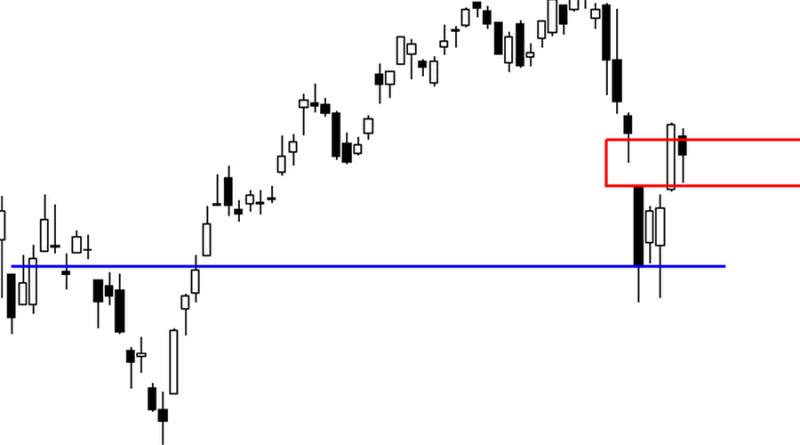
Sometimes beginners, seeing a gap on the chart, believe that the trend will continue. This is true but there are exceptions to this rule.
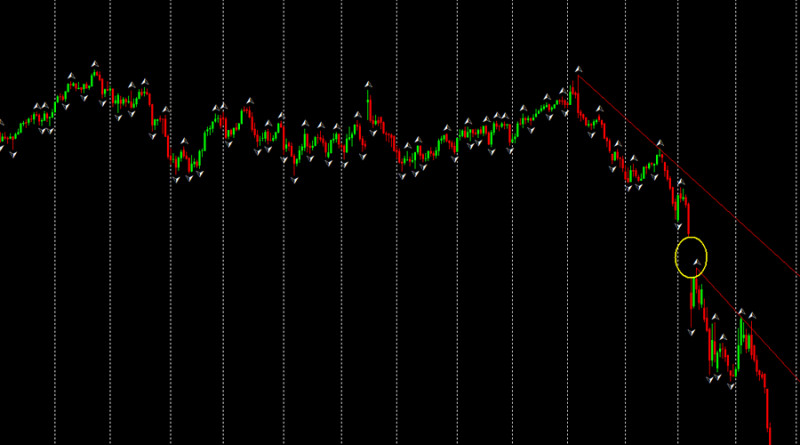
Sometimes a gap can indicate a change in the price direction. An example of the gap is shown in the screenshot.
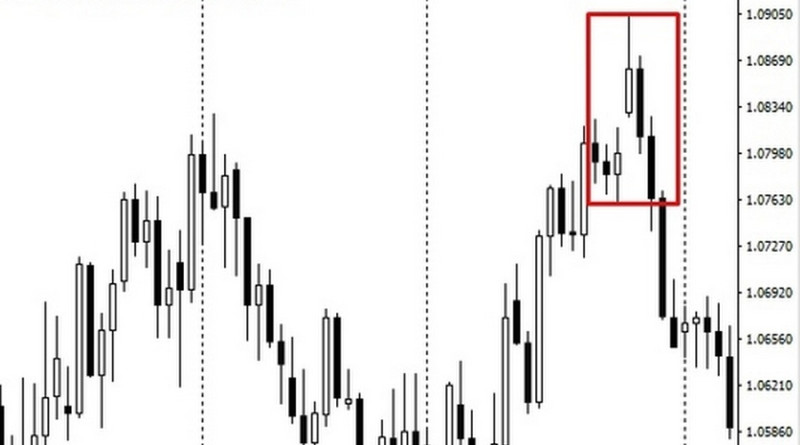
Thus, gaps can be used as graphical patterns or technical analysis tools.
One can trade with gaps using the following:
- A trend. In this case, two conditions should be met. The candlestick after the gap should have a similar direction, and before the gap, the market was moving sideways
- Reversal patterns. In this case, the gap and the existing trend have the same direction. Here you may open a position when the first reversal candlestick appears on the chart
- If we are talking about the dividend gap, then one of the trading options is to buy shares immediately after the publication of the size of the dividend and sell right before the gap appears.
Depending on the gap, it can be both a continuation pattern and a trend reversal pattern. In the first case, we are talking about a continuation gap, and about an exhaustion gap in the second case.
It is important to consider the asset being traded. Experts believe that in the currency markets, a gap should be used not so much for profit, but for safety.
To reduce the risks to zero in the currency market, it is better to close positions before the weekend.
How to trade
A gap can and should be used by market participants. At the same time, some of them may have a question: how to trade and make profits when using it?
The plan primarily assumes that the gap will be closed. Then the options for using it may be as follows
- if the price gaps down during the uptrend, it is better to buy the asset. That is, a trader buys it cheaper, and then, when the quotes return to their previous level, they can sell them at a higher price
- the opposite is true during a downtrend
Let's move on to trading strategies. Experts agree that both intraday trading and swing trading can be combined with the gap. However, scalpers find it difficult to trade using gaps.
In general, gap trading usually goes as follows:
- It is necessary to study the events in the Economic Calendar. Pay attention to those that are scheduled to occur over the next weekend;
- After that it is important to make a prediction about how the fundamental factors may affect the price of the asset;
- Then you need to predict in which direction the price will go and open a position before the weekend if you are confident in your prediction.
Meanwhile, you should follow these rules when trading using gaps:
- Adhere to the rules of risk management. To determine the appropriate trade volume, you can analyze the depth of gaps that have occurred previously
- If you are not sure about the direction and depth of the gap, do not take risks and close positions before the weekend
- If you prefer short-term trading, you may open a position according to the direction of the gap. As practice shows, at least several candlesticks follow the direction of the gap
- If you prefer to trade on the hourly chart or on the higher ones, trades should be opened according to the direction of a breakaway gap. If the gap is common or exhaustion, it is better to open trades against the direction of a gap
- if there are several candlesticks after the gap, which are aimed at filling the gap, a reasonable solution would be to take a pause in trading. In this case, it is not clear what will happen to the quotes after the gap is filled
- Do not make your trading plan based solely on gaps. When they appear, the trader's actions can be different, depending on the type of gap, its direction, etc.
- Make sure you define the type of gap correctly. This is important because exhaustion gaps predict a change in price direction.
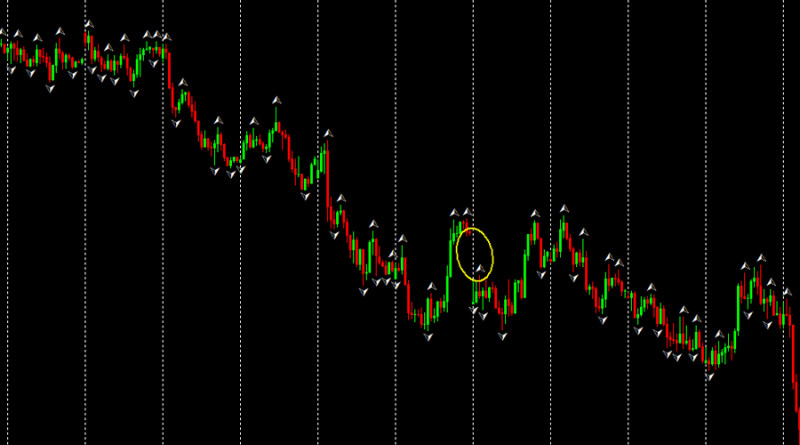
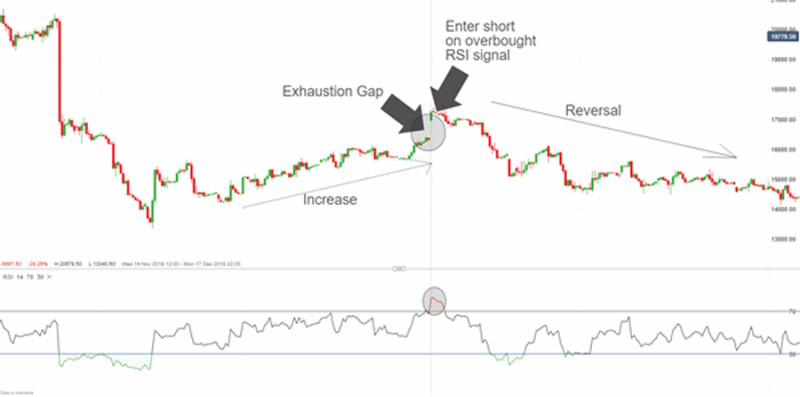
It can be difficult for novice traders, as well as those market participants who have not traded on a gap before, to make decisions about key price points. This means that opening and closing trades can cause doubt and uncertainty.
In this case, other tools can be used in trading. For example, the EMA and the Relative Strength Index. In the screenshot below, you can see that the RSI signals that an asset is overbought.
This means that after the exhaustion gap, it is better to sell the asset.
Conclusion
In this article, we discussed what a gap in trading is and how to use it correctly. This is quite an important factor, which cannot be ignored in trading but it is not the basis for building a trading strategy.
It is important to keep in mind that a gap often appears unexpectedly. That is why it is necessary to be fully prepared before important economic and political events, as well as before breaks in trading.
To test your trading skills, you can analyze the gaps that have already been observed on the chart and see how the quotes reacted after they appeared. On the basis of this, you can build your own trading ideas.
To reduce possible risks to zero, you can open a demo account with InstaForex and practice trading with a virtual deposit.
Recommended articles:
Full guide to riple top reversal pattern
Full guide to triple bottom reversal pattern
Full guide to double top pattern
Full guide to diamond reversal pattern and technical analysis
Full guide to head and shoulders pattern
How to trade using cup with handle pattern
Doji candle: What is it and how to use?
How to trade using pennant pattern
Dividend gap: Simple explanation


