


You are wrong if you think that there is nothing in common between geometry and trading. If you want to learn how they are connected, you can read the article "Types of technical analysis patterns: common and reversal".
In this article, we will talk about Japanese candlesticks, the patterns they form, as well as their importance and usage in trading.
Candlesticks in trading
Beginner traders hardly know why candlesticks and trading are connected. However, this technical analysis tool is quite popular among market participants.
This easy and accessible tool shows the price of an asset over a time period, allowing the user to make a forecast for the future.
It is used not only for analyzing currency pairs but also for securities, precious metals, crypto, and so on.
Japanese candlesticks are a time-tested tool, used in trading for several centuries. Since its creation in Japan to analyze rice prices in the 17th century, its relevance and popularity have grown exponentially.
Here is why the tool is so widely used nowadays:
- it is easy to use
- it is easy to understand
- it is informative
In order to assess all its advantages, it is important to understand the essence of Japanese candlesticks.
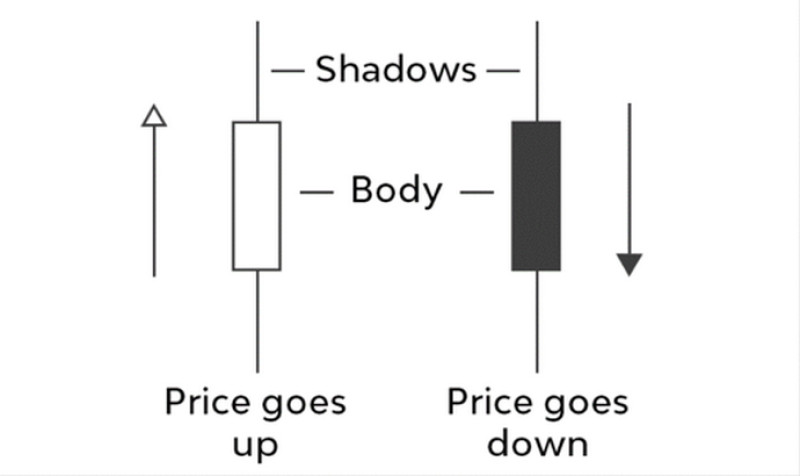
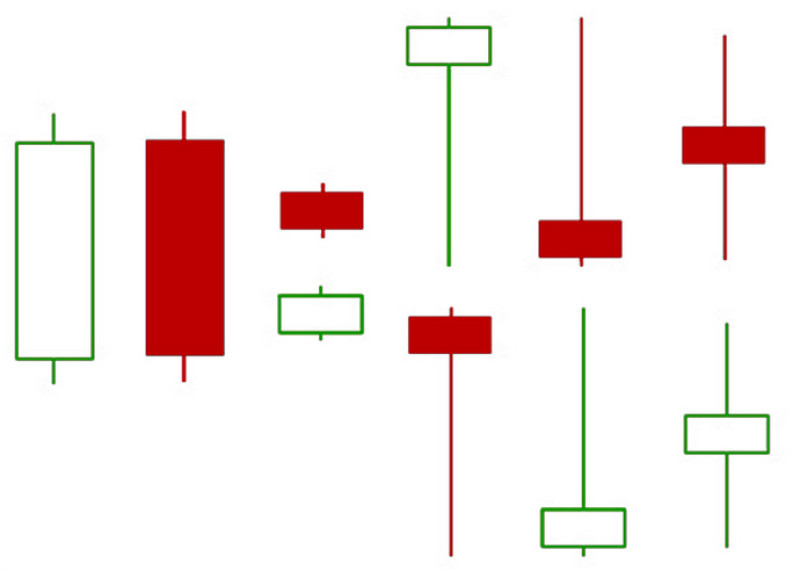
A Japanese candlestick consists of a rectangle and two vertical lines projected from its top and bottom.
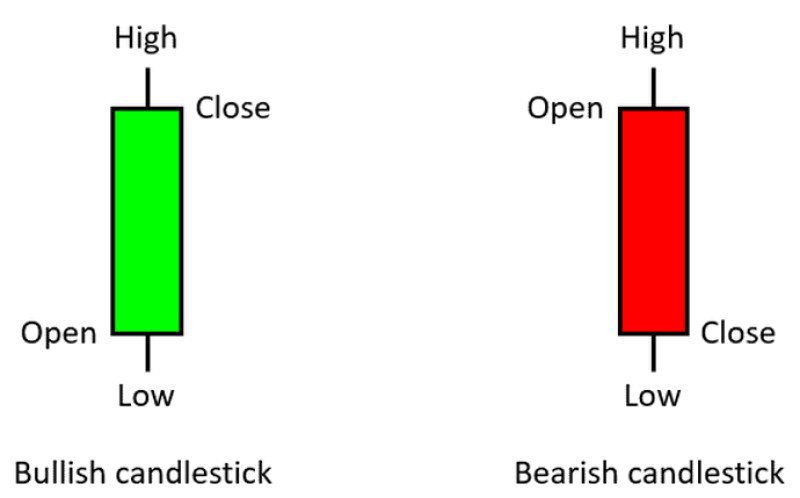
Each rectangle is called a “real body” and represents a market’s open and close prices over a time period.
Let’s take the EUR/USD pair on the 1-hour time frame with the open price at 1.0500 and the close price at 1.0534.
The Japanese candlestick’s body on the chart will be between these two marks, showing the price movement from the open to the close of a trading session. That is, it will reflect all trades over a given time period.
It is important to remember that a Japanese candlestick will look different if you change the time frame because other data will be taken into account.
The lines projected from the top and bottom of a rectangle are called wicks, although you will also see other names, like shadows and tails.
They depict the high and the low of the price in a given time frame.
Still, there are cases when the high and low are in line with the open and close prices. In such cases, a Japanese candlestick will have no wicks.
When the open price is in line with the close price, the body is shown as a thin line, that is, a candlestick has no body at all.
Therefore, each Japanese candlestick is very informative as it provides 4 different types of data. That is why this tool is more common than the linear one.
Moreover, it is easier to perceive compared to bars thanks to the body, colored differently.
Still, the tool has its disadvantages. Japanese candlesticks do not reflect how the price changes within a time frame.
In other words, a trader does not know whether a price movement was smooth or abrupt, and in what sequence it reached the high and the low. A trader can only see the result of a movement over a period of time and not the process itself.
In order to get more information, a trader should analyze Japanese candlesticks at lower time frames.
Types and meaning
Having an understanding of what a Japanese candlestick consists of is not everything. There are as many types of Japanese candlesticks as there are approaches to their classification.
Overall, Japanese candlesticks can be divided into two groups:
1. Bullish: these are green candlesticks on the back and white charts, indicating that the price is likely to rise. The color of a bullish candlestick can be changed if needed.
A bullish candlestick emerges when the price of an asset increases from the opening moment to the moment of the close. A candlestick is called bullish because the market is controlled by bulls.
2. Bearish: these are black or red candlesticks on the chart, indicating that the price is likely to fall. A candlestick is called bearish because the market is controlled by bears.
Japanese candlesticks can also be classified based on the body shape:
1. Doji: the main feature of such candlesticks is the body in the shape of a strip. This is a classic doji candlestick pattern, although it is quite rare in trading.
This pattern develops when the open price and the close price are in line.
Meanwhile, the so-called “imperfect” doji candlestick patterns are observed more often. They emerge when the open price is similar but not in line with the close price. On the chart, an imperfect pattern has a tiny body.
Although such candlesticks can be either bullish or bearish, they often indicate a flat market.
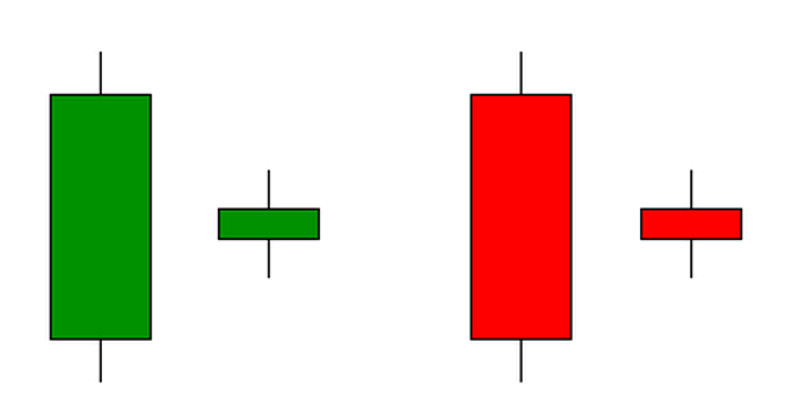
2. A long-bodied candlestick pattern: this is a candlestick with a long real body.
3. Marubozu: it is a candlestick with a long body and barely any shadows. However, candlesticks without any shadow rarely emerge on the chart.
A Marubozu Japanese candlestick indicates that either bears or bulls are in full control over the market.
It is important to understand that the longer the body is, the more active bulls/bears are. When it is about a long bullish Japanese candlestick, aggressive buyers are driving up the market.
Conversely, when it is about a long bearish Japanese candlestick, sellers are in full control over the market.
Still, before making any conclusion, a trader should evaluate the current market situation and the factors that precede it.
Thus, if a long bullish candlestick appears after a prolonged fall, it means a reversal may occur. Conversely, if it emerges after a protracted uptrend, it could reflect an overbought condition.
The same applies to bearish Japanese candlesticks.
Wicks carry important information as well. They can show how the price behaves within a time frame.
Short wicks indicate that an asset trades near the open/close price. That is, the price mostly moved within the indicated range, without any significant breakouts through its limits.
Here is how candlesticks can differ depending on the length of their shadows:
- when the upper wick is longer that the lower one, it means that bulls were active over a period of time and bearish activity increased just by the close of trading.
- when the lower wick is longer than the upper one, it illustrates the opposite situation with bulls active by the close of trading.
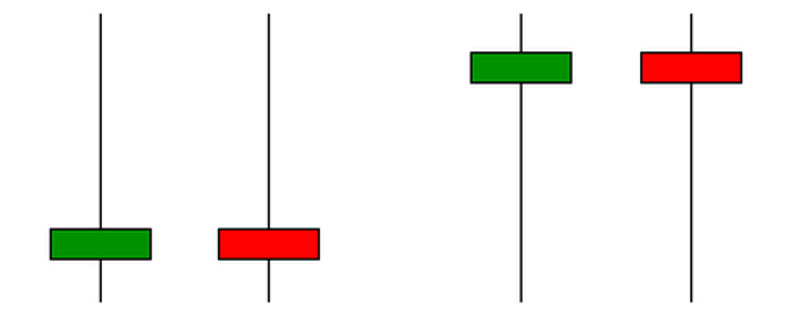
- when the upper and lower wicks are almost equally long, it reflects a mixed situation in the market with both bulls and bears trading aggressively. In addition, if a candlestick has a small real body, it means that bullish and bearish powers were equally strong.
For beginners, it may seem to be a mission impossible to remember all the features of Japanese candlesticks to use the tool effectively. Only trading can help market players understand them better and master their skills.
Japanese candlestick patterns
In order to forecast future price behavior with the help of Japanese candlesticks, a trader should identify certain patterns on the chart. They can be either simple, consisting of one element, or complex.
The primary goal of candlestick analysis is to find patterns on the chart.
The past patterns indicated either a reversal or the continuation of a trend. Therefore, they may signal the same now.
Although there are dozens of candlestick patterns, it does not mean that all of them should be applied at once. Still, when trading, you should use the most common patterns at least.
At the same time, it is important to remember that using just Japanese candlesticks can be quite risky. That is why you should turn to additional technical tools, support and resistance levels, and so on.
There are two types of Japanese candlestick patterns:
- indicating a trend continuation
- signaling a reversal
We will take an insight into these patterns later on.
Meanwhile, signals made by Japanese candlestick patterns can also differ in the degree of reliability, which, in turn, depends on the time frame.
The most unreliable signals come from patterns in time frames lower than 1 hour. In such a case, switching to a higher time frame could be a way out.
Here are the key features of candlestick patterns:
1. Subjectivity. Each trader can see a different pattern on the same chart or none at all.
Therefore, they can analyze data differently.
2. Diversity. On the one hand, it can be for the better that each trader can choose the most appropriate pattern.
Still, it can be difficult for beginners to remember even the most common patterns.
3. Availability. Candlestick charts are available on trading platforms. Therefore, to see patterns on the chart, traders will only need their skills.
Consequently, Japanese candlestick patterns can be an effective technical tool when used properly. When wrongly identified, they pose the risk of losing funds.
How to read Japanese candlestick patterns
As you now know, candlestick patterns can signal either a reversal or the continuation of a trend. A trader can use this valuable information when entering the market.
Indeed, it is important to know about further quote movements when opening trades. For instance, when the bull trend extends, it is wiser to go long. Conversely, short positions should be considered when the trend reverses.
This information can be interpreted taking into account the following features:
- Shape and height of candlesticks
- Correlation between the open and close prices
- Balance between wicks and the real body
At the same time, the real body should be given primary importance over wicks.
The thing is that the length of the real body illustrates the confrontation between two market participants - bulls and bears. So, if the body of the following candlestick is longer than that of the previous one, it means one of the parties is more powerful than the other.
When the real body is green or white, bulls have been in control of the market over a given time period. When the real body is red or black, the market is under bearish control. The longer the real body, the stronger one of the parties.
Meanwhile, when the real body is of average or small height, it means bulls and bears are equally powerful. This is when a correction could occur or a sideways trend could continue.
At the same time, shadows illustrate market sentiment. So, short wicks show certainty in the market. Conversely, long wicks indicate market uncertainty.
Here are the key principles of reading candlestick patterns:
- The market is flat when Japanese candlesticks have short real bodies and wicks;
- Bulls and bears are equally active when Japanese candlesticks have short real bodies and long wicks. In this case, a lot will depend on who wins. By the way, the length of shadows can reflect the strength of a reversal. Those pin bars are usually the strongest that emerge at extreme levels;
- Japanese candlesticks having longer real bodies and shorter wicks show that either bulls or bears are more powerful. This usually takes place at the beginning or the end of a trend.
These principles allow traders to get a picture of what is going on in the market, feel its sentiment, and see who – bulls or bears – are more active at a given moment.
Japanese candlesticks: trend continuation patterns
Trend continuation patterns signal that the current trend will continue.
Some trend continuation patterns have strange names, which can be confusing for beginner traders. However, they carry such names for a reason.
Their unusual names help memorize and find patterns on the chart.
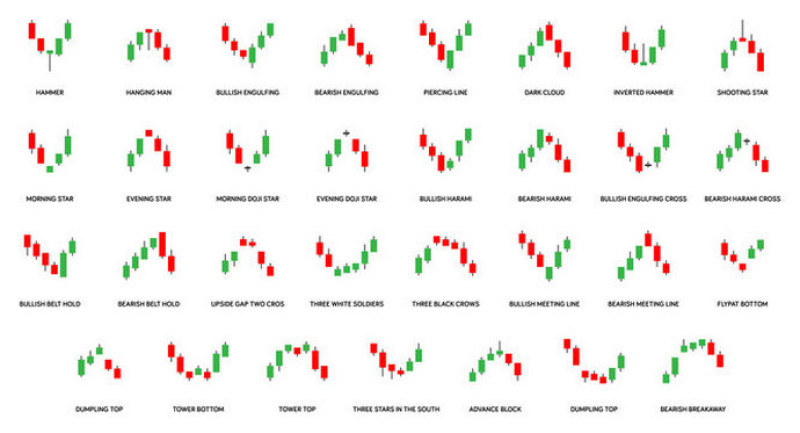
Here are some examples of trend continuation patterns:
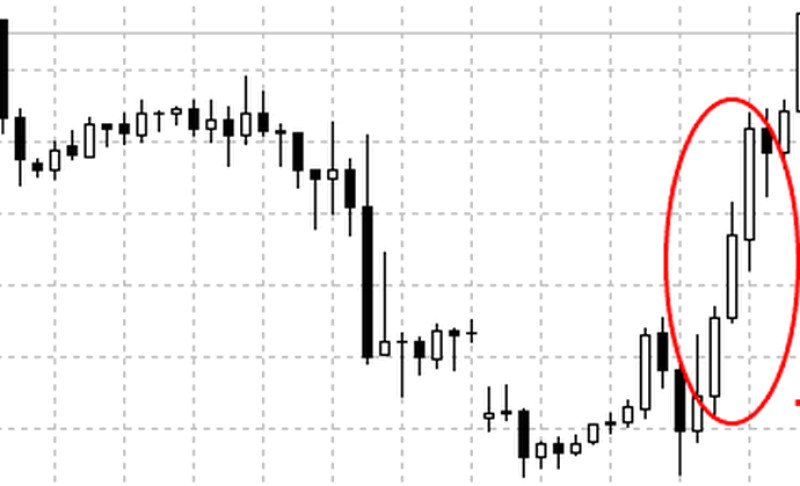
- Three White Soldiers is a candlestick pattern consisting of three bullish Japanese candlesticks. The pattern occurs when three important conditions are met.
Firstly, the close price should rise from one candlestick to the other. Secondly, the open price of each new candlestick should be at the same level as the real body of the previous one.
Lastly, the market should generally be either in a bull trend or in a corrective move. Otherwise, it could be considered a reversal pattern.
This pattern signals that the bull trend has growth potential. At the same time, the elements of candlesticks should not be too long, as it may be a sign of an overbought condition.
2. Three Black Crows is a pattern, consisting of three bearish Japanese candlesticks that indicate the continuation of a bear trend.
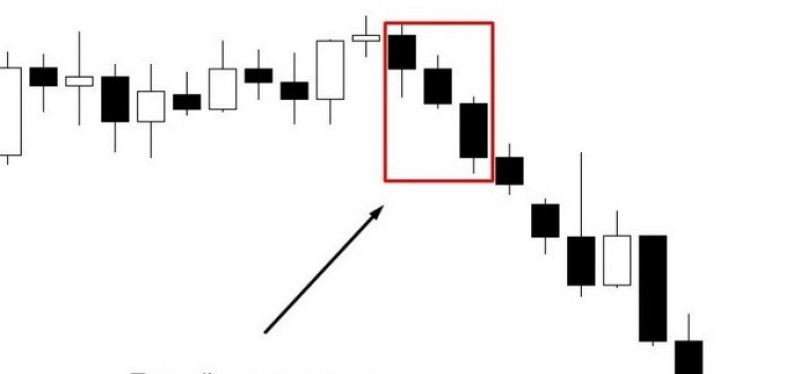
As a reminder, both patterns can illustrate a reversal. Thus, the Three White Soldiers pattern is found at the end of a bear trend.
Meanwhile, the Three Black Crows pattern appears at the end of a bull trend.
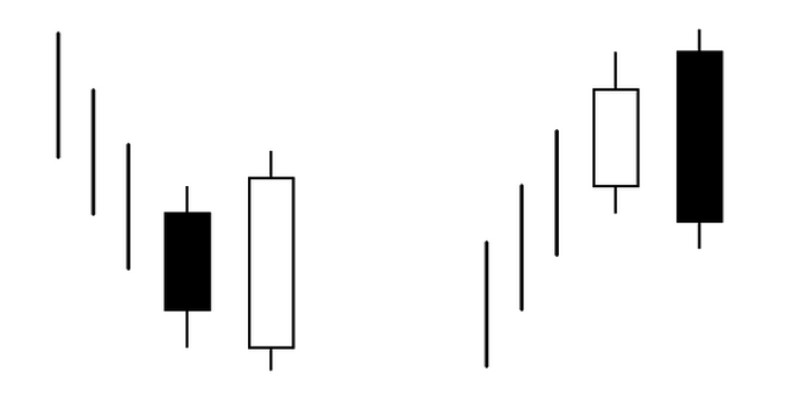
3. Thrusting Line and Separating Line are patterns with a bearish candlestick followed by a bullish candlestick. These patterns usually emerge during a bear trend.
This is the case when no attention is paid to wicks. The focus should be solely on the real body. The Thrusting Line pattern can be found on the chart when the second candlestick closes within the real body of the first candlestick. At the same time, the price should not cross the middle of the real body of the first candlestick.
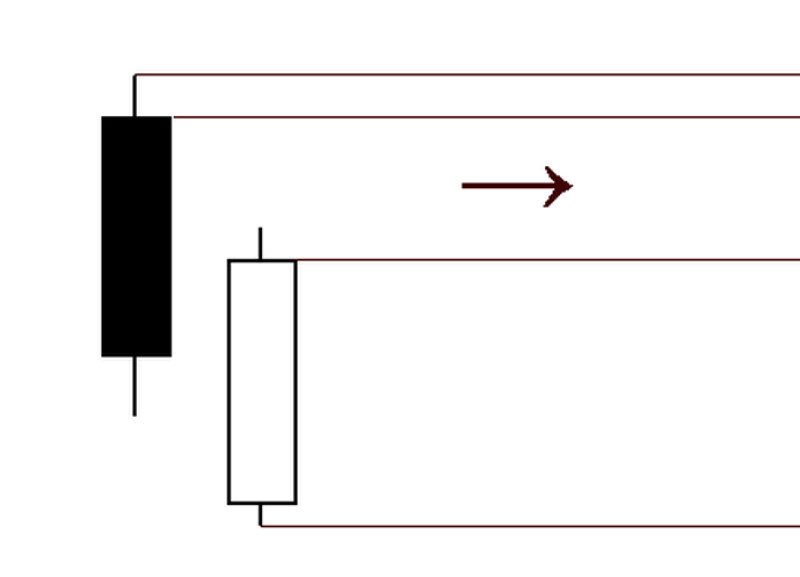
The Separating Line pattern often forms when the second candlestick closes at the same level as the first one.
4. Gap is a pattern consisting of two candlesticks of the same color. The second candlestick opens the gap.
The gap’s shadows show that a reversal, which was about to begin, did not occur.
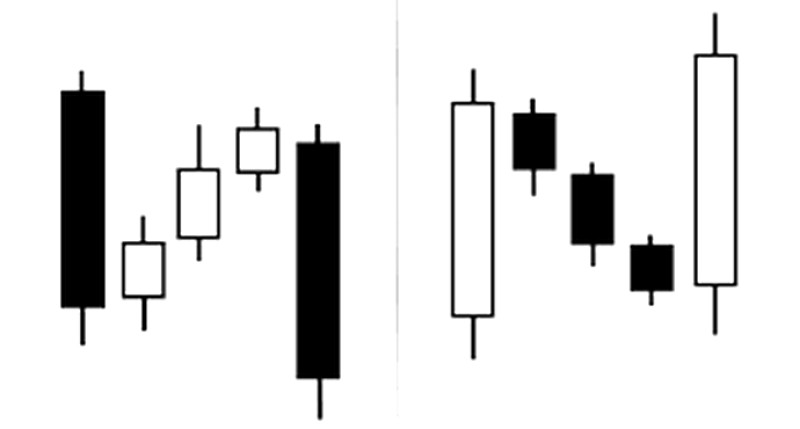
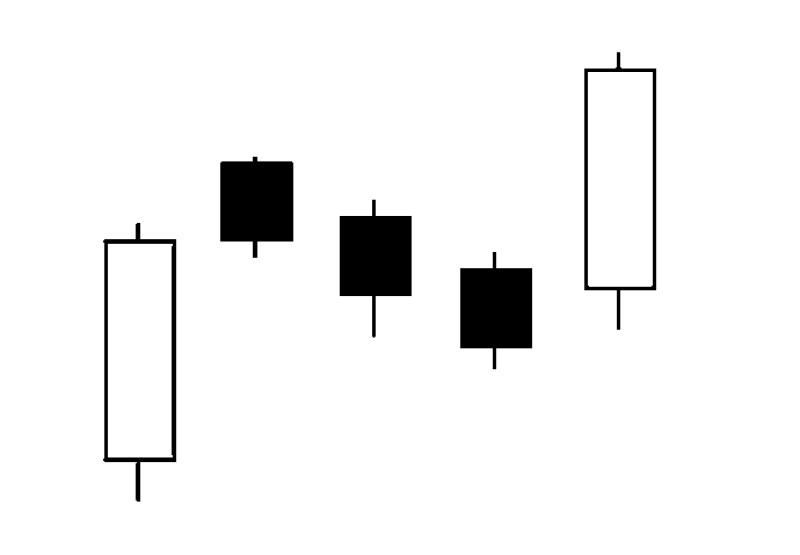
5. Three Methods is a pattern comprised of five Japanese candlesticks. The first and the last candlesticks indicate the trend, while the other three illustrate consolidation.
The first and the last candlesticks are of the same color and the remaining ones are of a different color. In addition, the last candlestick should close above the high of the first one if it is a bull trend, or below its low in case of a bear trend.
6. Mat Hold. This is a variation of the Three Methods pattern. It also consists of five candlesticks, with the first and the last candlesticks indicating the trend.
The three small candlesticks can be of different colors.
At the same time, it is important that:
- the second candlestick is outside the real body of the first one, and there is a price gap between them;
- the last candlestick closes below the bottom of the second one if it is a bear trend, or above its top in case of a bull trend.
These are just examples of all existing continuation patterns. In addition, there are other tools showing trend continuation that can be used in trading:
- Three Line Break
- Side-by-Side White Lines
- Tasuki Gap and so on.
Japanese candlesticks: reversal patterns
These are patterns signaling a reversal. Their number exceeds that of continuation patterns. Moreover, some of them are more popular.
When a trend reverses, the market situation and the balance of power drastically change. Therefore, every trade should know about a reversal in advance to open/close trades in time.
Here are some examples of reversal patterns:
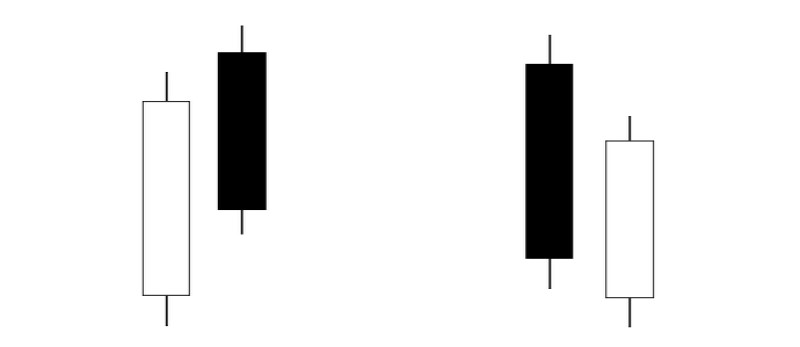
1. Engulfing. This pattern can be either bullish or bearish and comprises two candlesticks of different colors.
The real body of the second candlestick is longer than that of the previous one as if engulfing the candlestick on the left.
When the second candlestick is white or green, it is a Bullish Engulfing pattern. The pattern is bearish when the second candlestick is black or red.
In other words, the pattern indicates a reversal to the upside in the first case and to the downside in the second case.
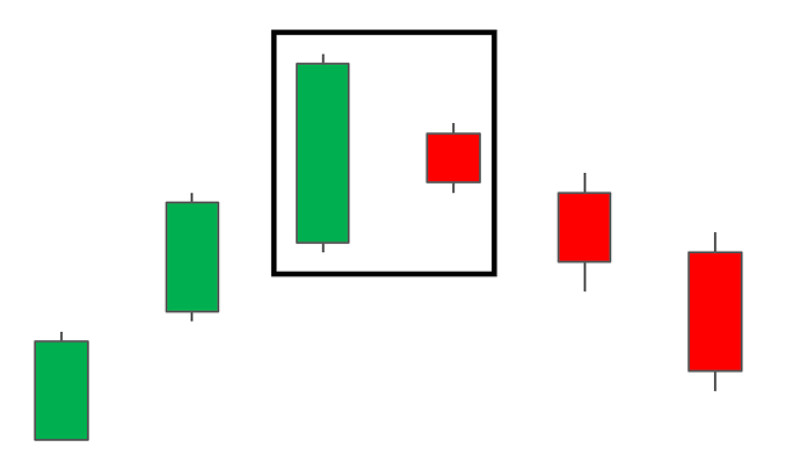
2. Harami is a reversal pattern, which is the opposite of the Engulfing pattern. Here the second candlestick is within the first one, and both of them have different colors.
Thus, when a black/red Japanese candlestick comes first, we have a Bullish Harami pattern.
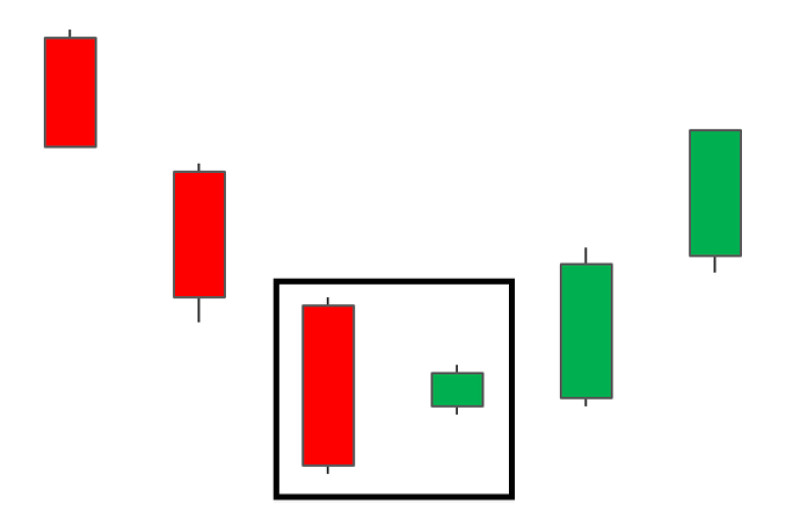
Meanwhile, when the first candlestick is white/green, it is a Bearish Harami pattern.
In both cases, it is important that a reversal is confirmed. Otherwise, risks will mount. A Japanese candlestick following the Harami pattern could be used for confirmation. It should be of the same color as the last candlestick in the pattern.
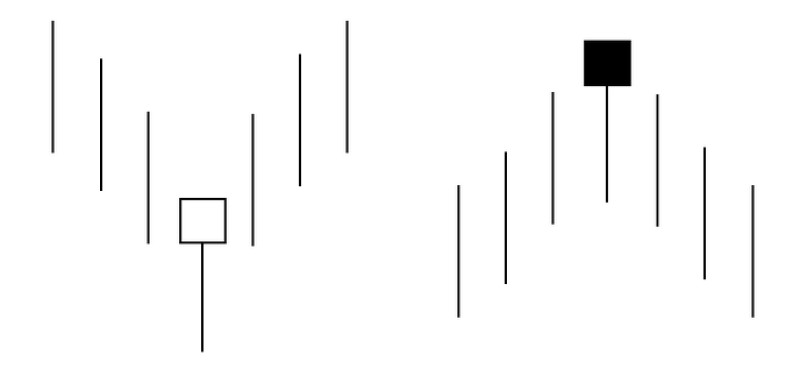
3. Hammer is a pattern consisting of one Japanese candlestick. A small real body and a long low wick are its main features.
Moreover, the low wick should be at least twice as long as the body. At the same time, the body should have a short top wick or no wick at all.
The body itself should not be long. This is the case when the color of the body does not matter because the focus is solely on the trend.
A long low wick illustrates a bullish reversal. In other words, the pattern occurs during a bear trend.
The candlestick following the pattern is used for confirmation.
Hanging Man is a candlestick pattern that emerges when the bull trend reverses.
There is also an Inverted Hammer pattern, which is a mirror reflection of an original Harami pattern. That is, it has a long top wick.
Like a Hammer, an Inverted Hammer is a bullish candlestick pattern.
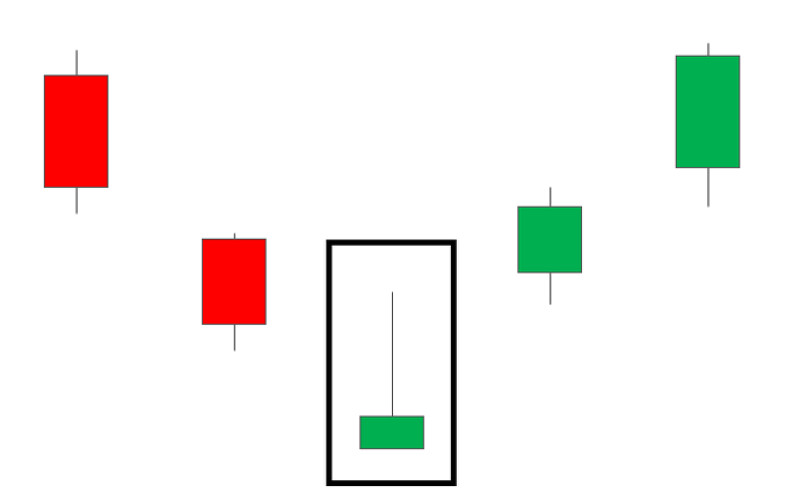
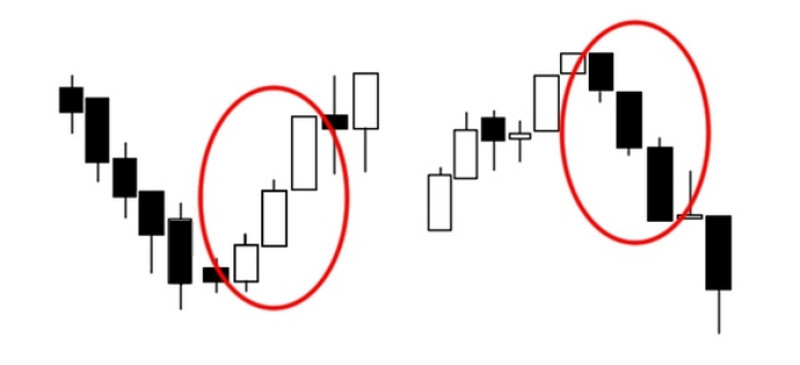
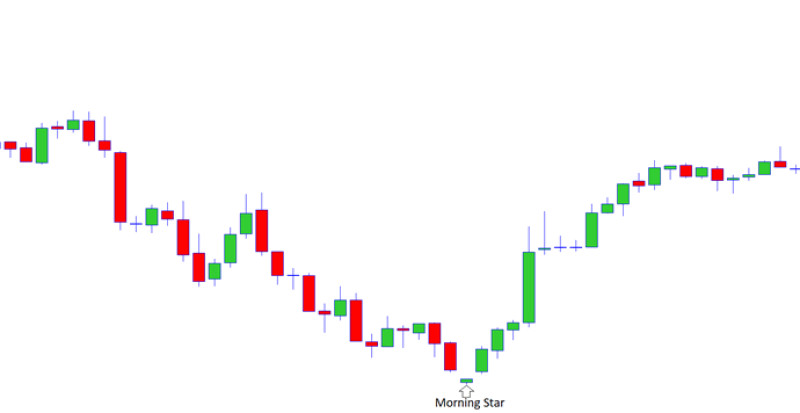
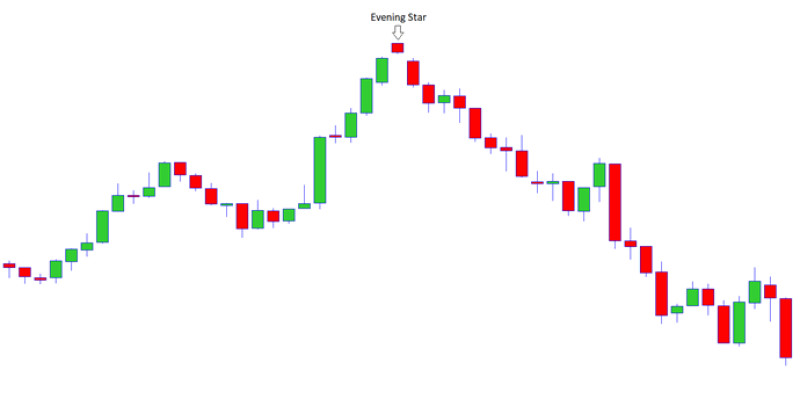
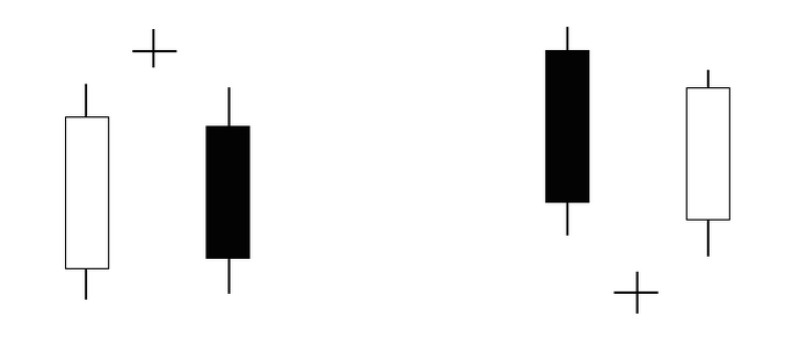
4. Star is a pattern consisting of three candlesticks. This pattern can be of two types: a Morning Star and an Evening Star. They illustrate bullish and bearish reversals respectively.
A Morning Star is a formation where:
- the first bearish candlestick has a relatively long body, it indicates a bearish trend.
- the second candlestick has a small body, which can be either bullish or bearish.
- the third candlestick is bullish and closes above the first one.
A Morning Star is a mirror reflection of a Morning Star pattern. It appears on the chart when a bullish trend is about to reverse.
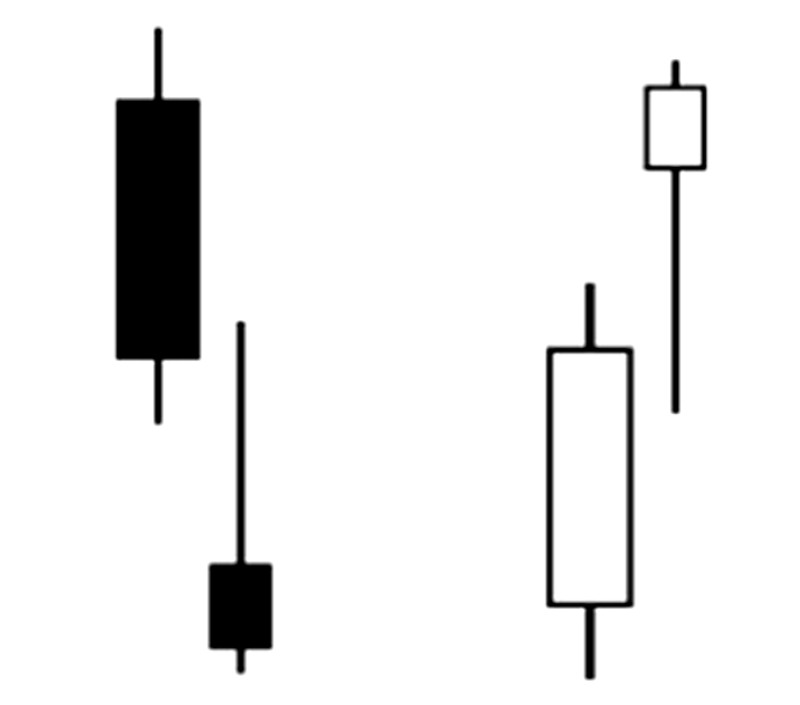
5. Dark Cloud Cover and Piercing Line are opposite patterns, comprising two candlesticks of different colors.
When the first bullish candlestick is followed by a bearish one with at least half of the body of the first candlestick being within the second one, we have the Dark Cloud Cover pattern.
Meanwhile, when the first bearish candlestick is followed by a bullish one, it is the Piercing Line pattern.
6. Abandoned Baby. This pattern can also be bullish and bearish. It is made up of three Japanese candlesticks. The first candlestick with a long body is followed by a doji. The final candlestick has a long body as well. All elements of the formation are of different colors.
The Bullish Abandoned Baby pattern begins with a black/red candlestick and ends with a white/green one. As for the Bearish Abandoned Baby pattern, the situation is the opposite.
Other examples of reversal Japanese candlestick patterns:
- Harami Cross
- Tweezers
- Tower and more
Reversal Japanese candlestick patterns: important aspects
As you now know there are a lot of reversal Japanese candlestick patterns. Examples provided in this article are those commonly used. So, they can be called common reversal patterns.
No matter the reversal pattern, there are certain rules you should follow when working with them. Here are the most important rules:
- Do not use time frames lower than H4 to identify reversal patterns.
- Look for reversal patterns when the price is either at its peak or its bottom.
- Never search for reversal patterns during a flat market.
- Learn all the common reversal patterns. You may never encounter other reversal patterns while trading because they occur rarely.
- Use technical indicators, including a Japanese candlestick following the pattern, to confirm any formation.
- Pay attention to structures similar to reversal patterns when trading because ideal reversal patterns can occur rarely or never.
- A reversal pattern on the chart does not fully guarantee a trend will actually reverse as it may turn into a correction or a flat. Therefore, make sure a reversal pattern is confirmed.
Indicators
Read the article “Trend reversal and continuation patterns: complete guide” to learn more about various patterns. Now let’s talk about how to find candlestick formations on the chart.
Special tools have been designed to find trading patterns on the chart. All a trader should do is open positions in the right direction. Thus, if a trend is expected to extend, you should trade with a trend. Otherwise, you should open positions taking into account an impending reversal.
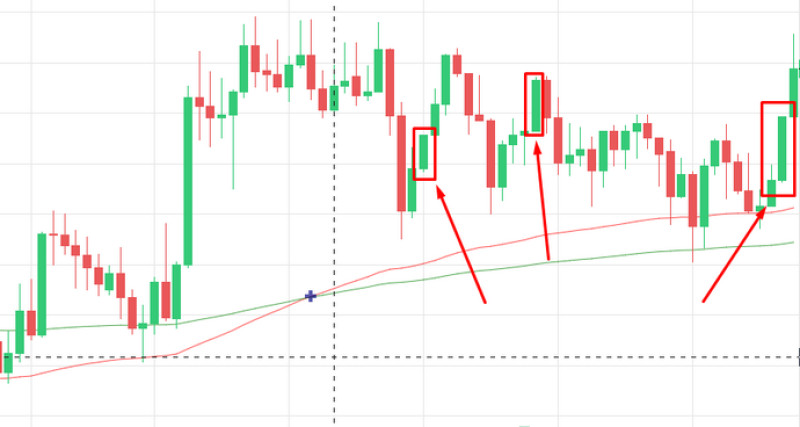
The Candlestick Pattern Indicator (CPI) is the most popular tool that alerts traders when patterns emerge on the chart.
The CPI illustrates the right entry moments with arrows. Red down arrows signal to sell an asset. Green arrows show it is time to buy an asset.
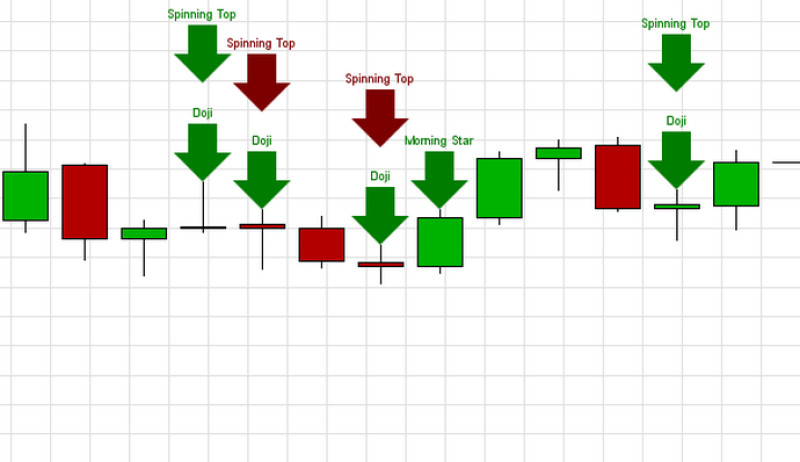
The indicator settings allow you to enable/disable sound alerts as well as change the color of arrows, text, and the number of elements used for analysis. In order not to overload the chart, you can also activate/deactivate the search for specific patterns.
Other indicators in this group work based on a similar principle. In addition to Candlestick Pattern Indicators, these tools include:
- Patterns
- InsideBarSetup
- Pattern Options and more
With their help, you will find candlestick patterns on the chart quickly and easily. In addition, with these indicators, subjective interpretation, which is possible when trader searches for patterns themselves, is no longer a problem.
Japanese candlesticks: trading
Trading with a candlestick chart might seem easy at first glance. After all, having found a certain formation, all a trader should do is open a trade in the right direction or pause trading on time.
However, the main intricacy here is to find a candlestick pattern. Moreover, given a long list of such formations, it is simply impossible to use them all to make trading easier, even when applying indicators.
Therefore, traders should focus on the following principles:
- use up to five patterns in the beginning and learn how to use them
- choose appropriate additional technical analysis tools.
Most traders use Japanese candlesticks and patterns only with trend lines, support, and resistance. Indeed, it would be unwise to use just signals that come from Japanese candlesticks.
Trading rules:
- The daily chart is the most suitable chart for candlestick analysis. The lower the time frame, the more unreliable the signals.
- Study the weekly chart and higher time frames to get information about long-term trends.
- Identifying a pattern on the chart can be challenging for beginners. Therefore, they should practice demo trading first or open trades using smaller lot sizes.
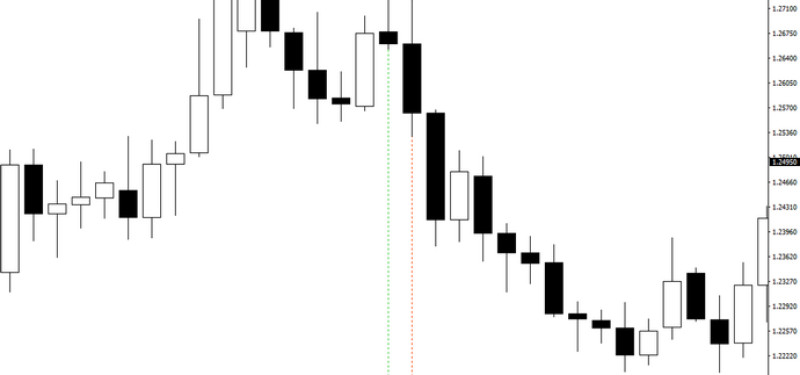
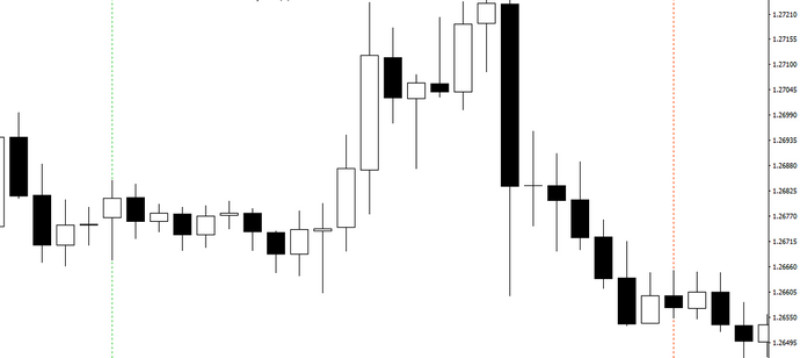
- Use a lower time frame to see how the price changes within a time period. This is the way to find out whether changes were smooth or zigzag.
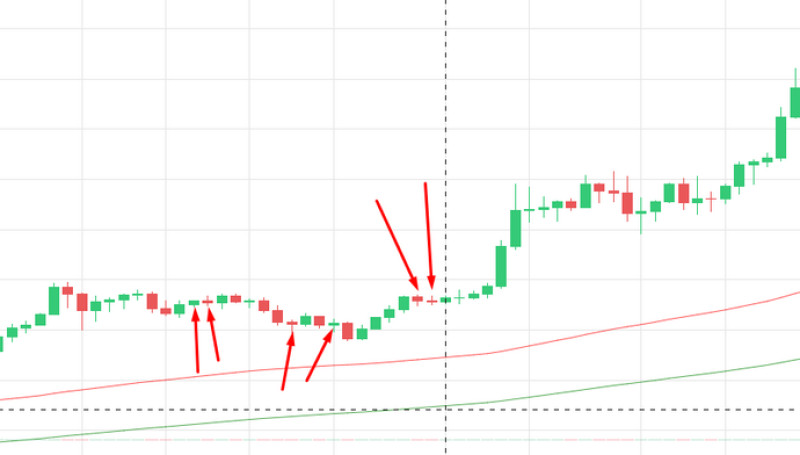
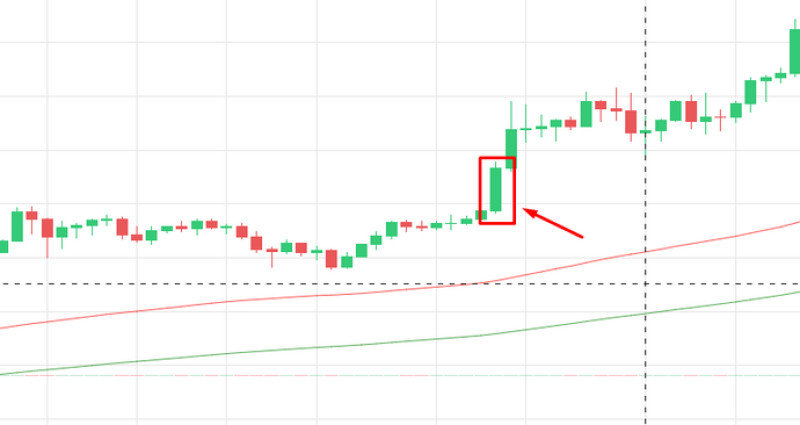
Images below show how a pin bar that formed on the daily chart is analyzed based on the H1 chart.
5. Patterns with a price gap are more reliable. Still, it is important to remember that they do not occur as often on Forex as in the stock market.
6. If you use patterns for opening/closing trades, make sure they are confirmed.
7. Refrain from trading when several patterns emerge on the chart at once.
At the same time, remember that Japanese candlesticks and the patterns they form are in no way a fully-fledged strategy and does not guarantee profits.
Final thoughts
So, to sum it up, Japanese candlesticks provide traders with details about the asset value and are a universal tool. Japanese candlesticks are used not only in forex trading but also in other markets.
Undoubtedly, newcomers may find it hard to study and apply Japanese candlestick patterns, but practice and determination can help them achieve desired results.
In addition, other indicators can make the complex and monotonous process of identifying formations a lot easier.
Read more:
Triple Top: all about reversal pattern
Triple Bottom: reversal pattern and trading
Double Top and trading: complete guide
Diamond reversal pattern: guide
Head and Shoulders pattern: complete guide
Flag pattern in technical analysis
How to use Cup with Handle pattern
Doji candle: meaning, types, and usage виды
Pennant pattern: meaning and usage


